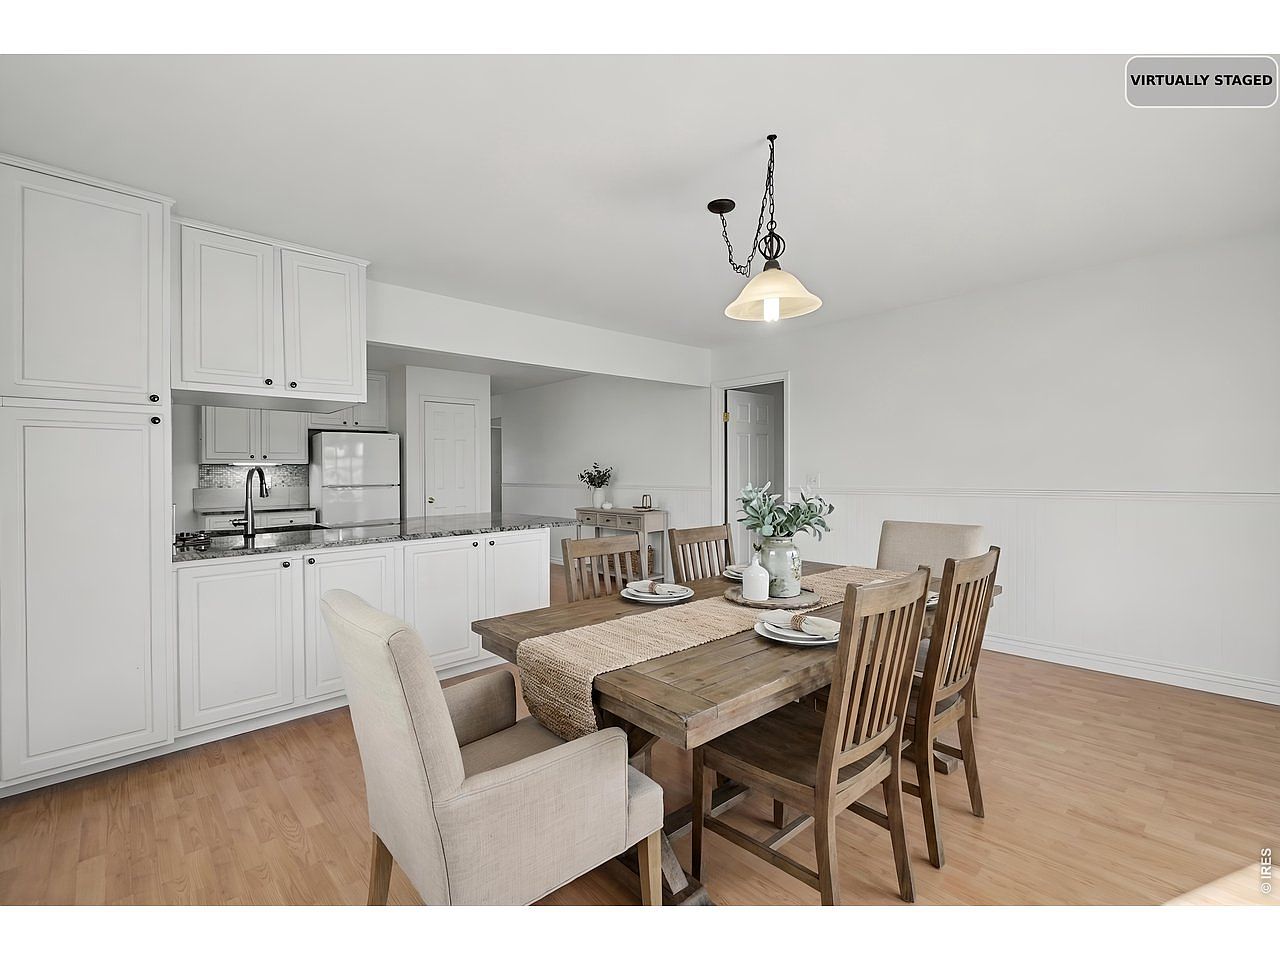
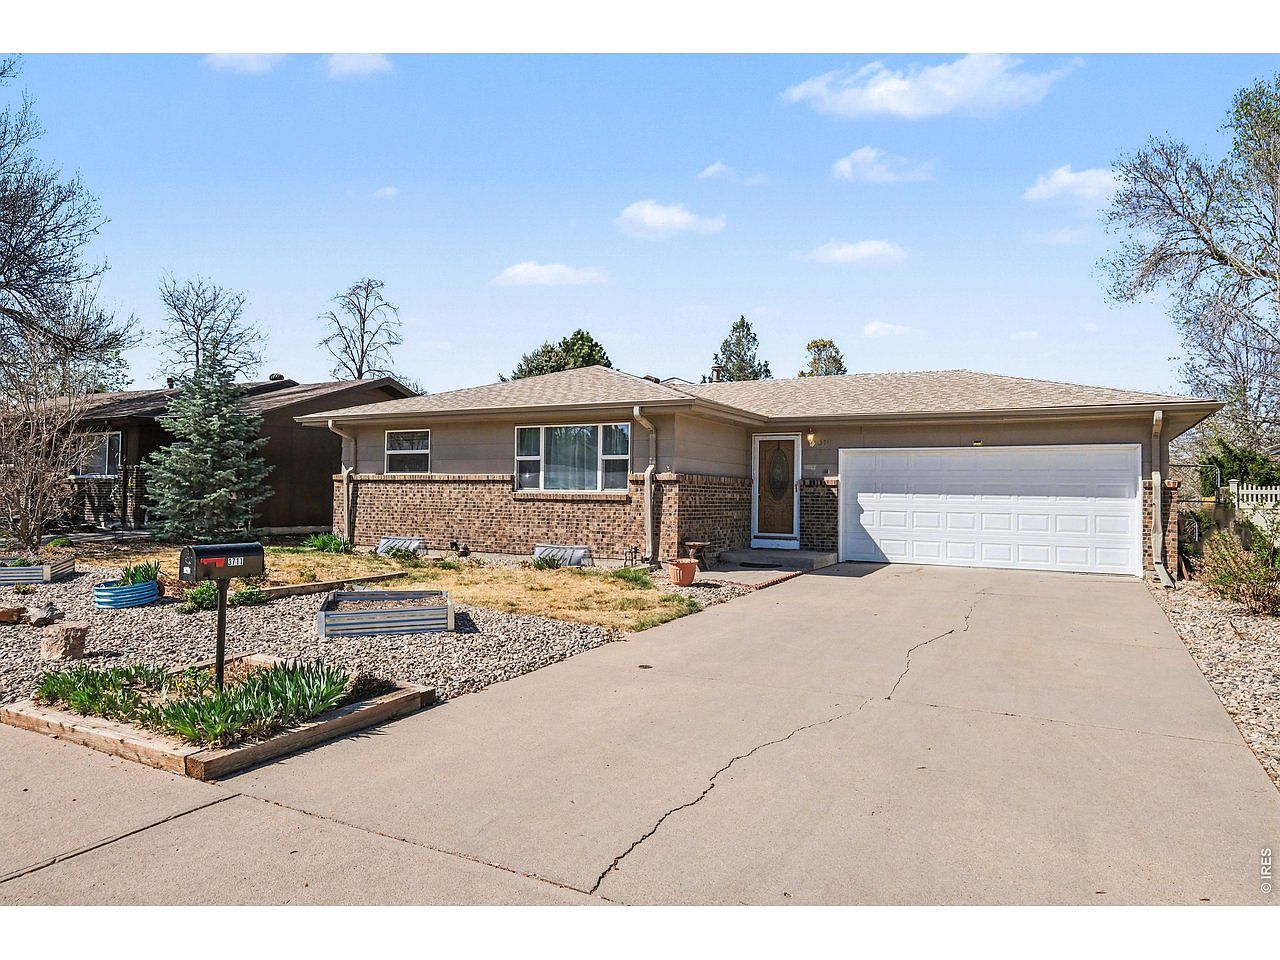
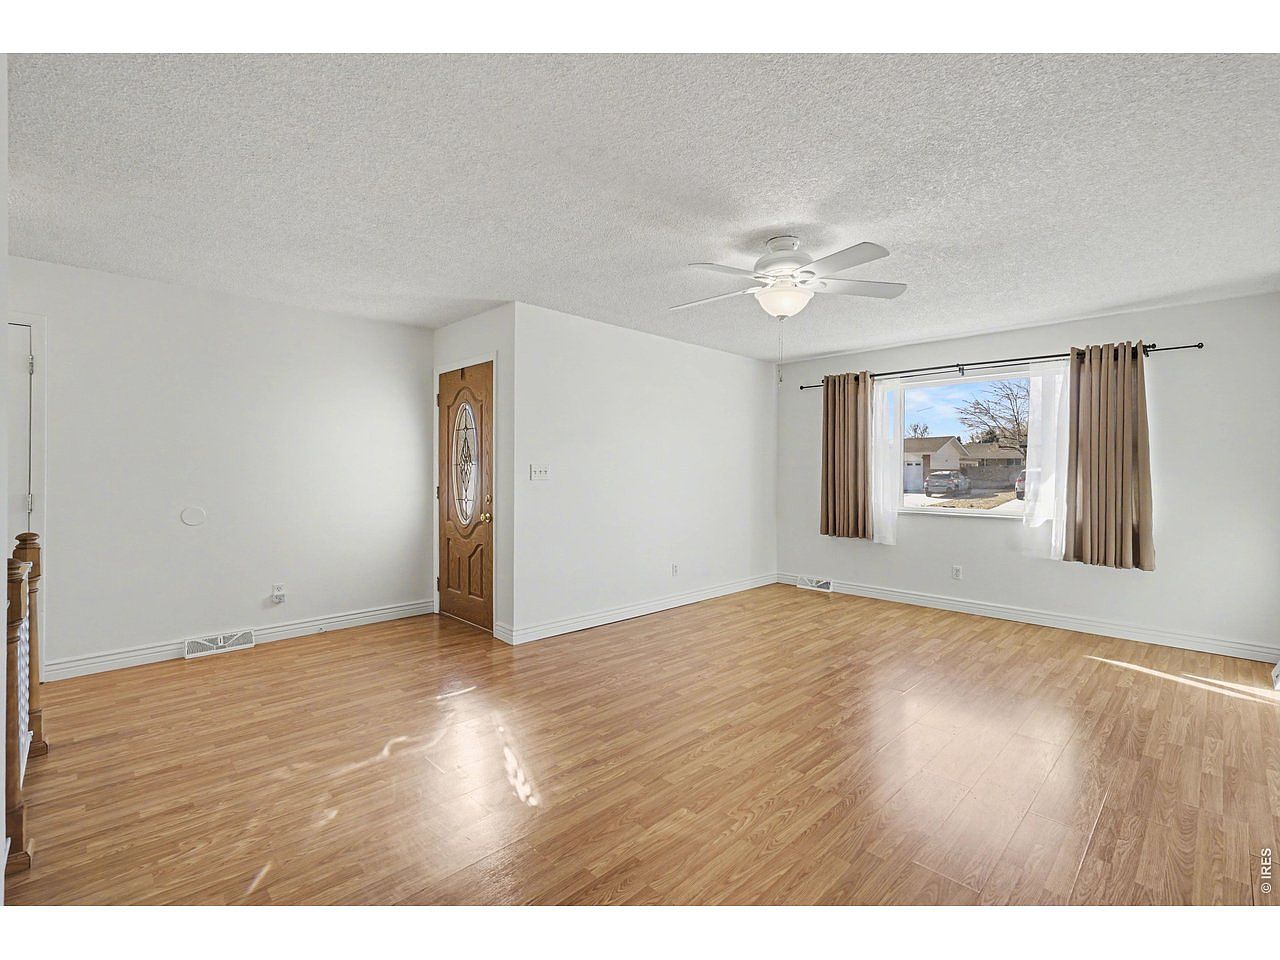
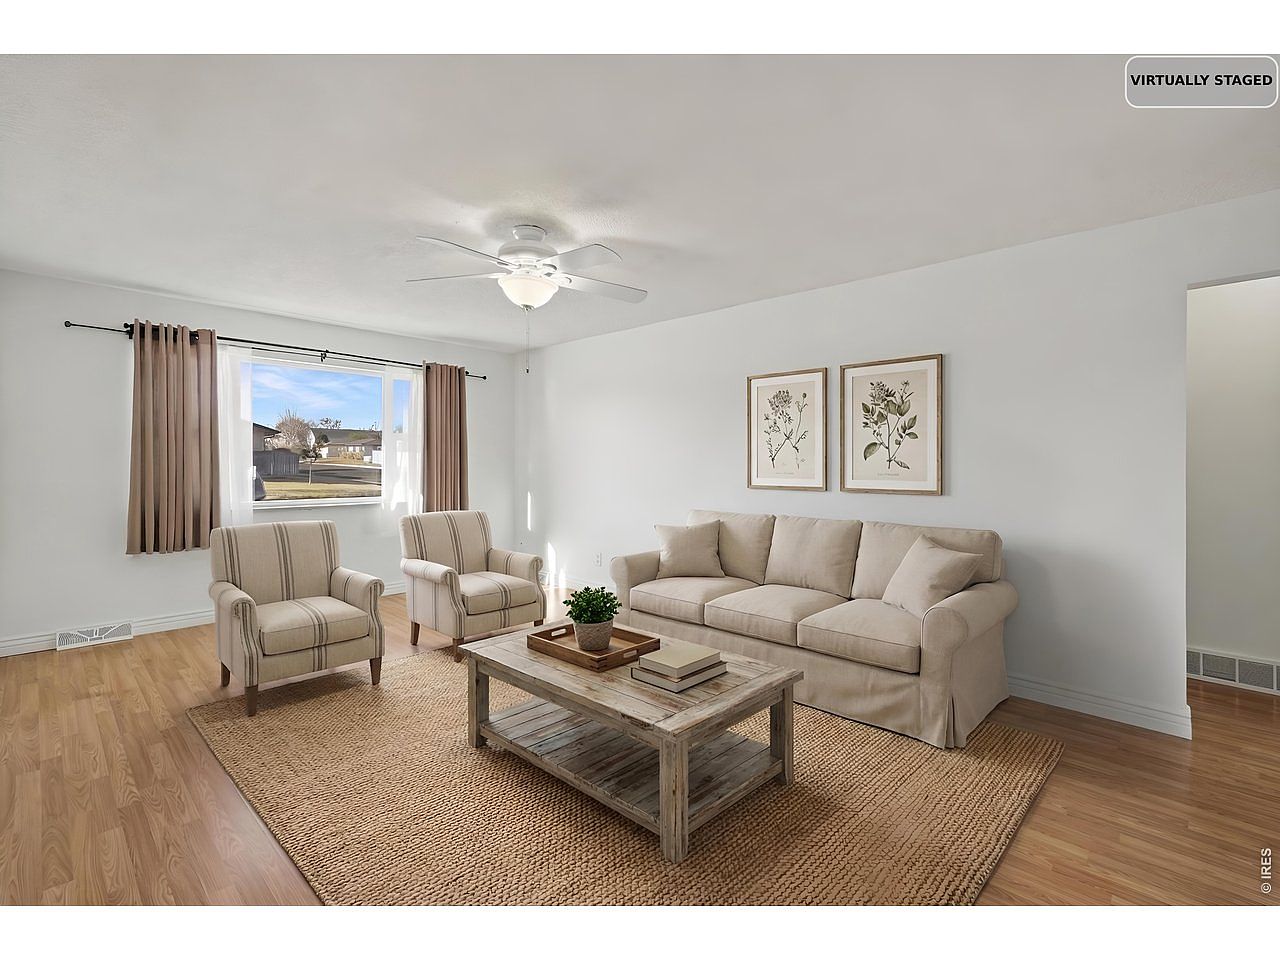
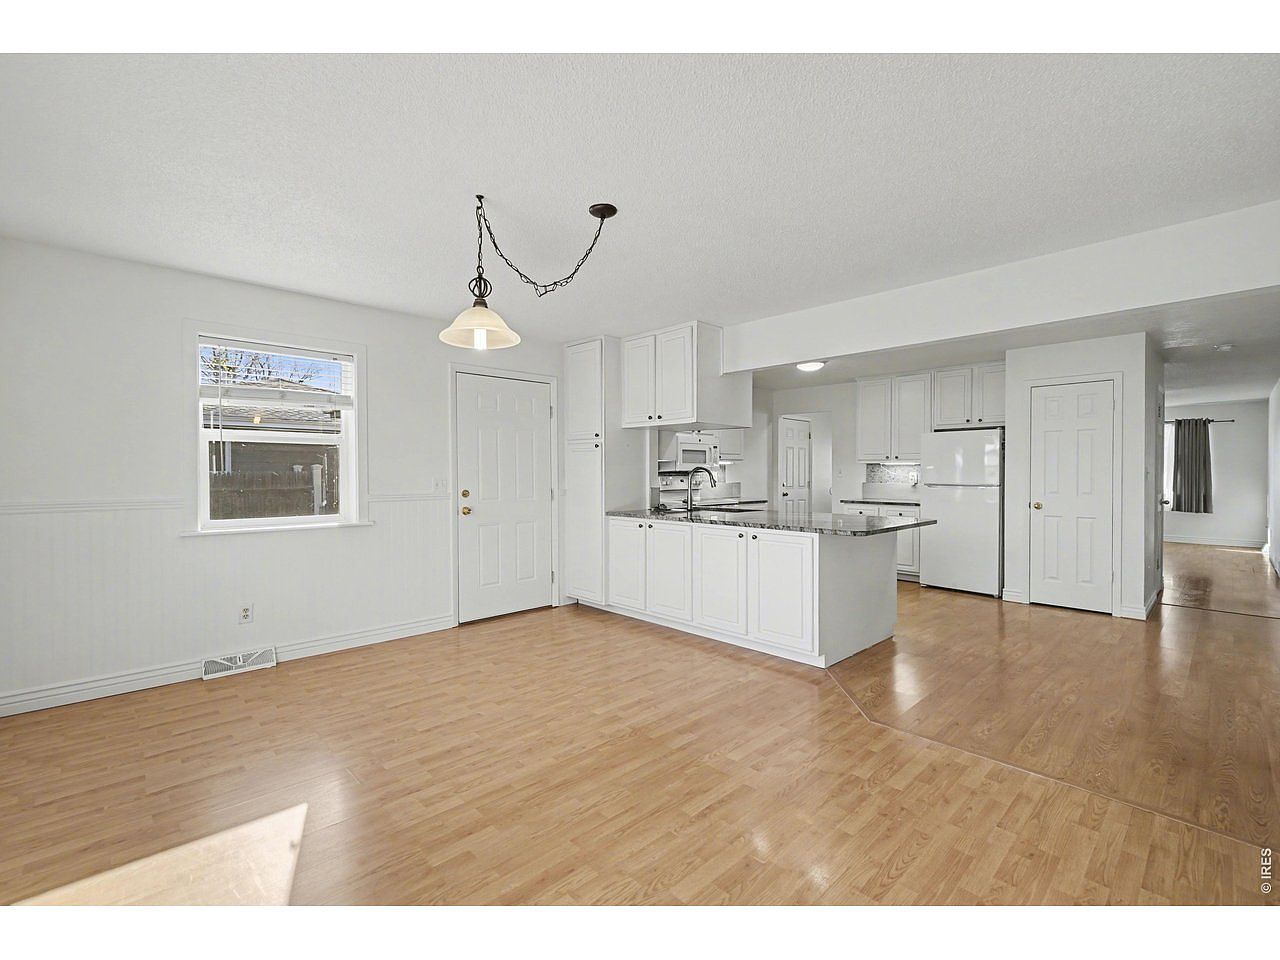
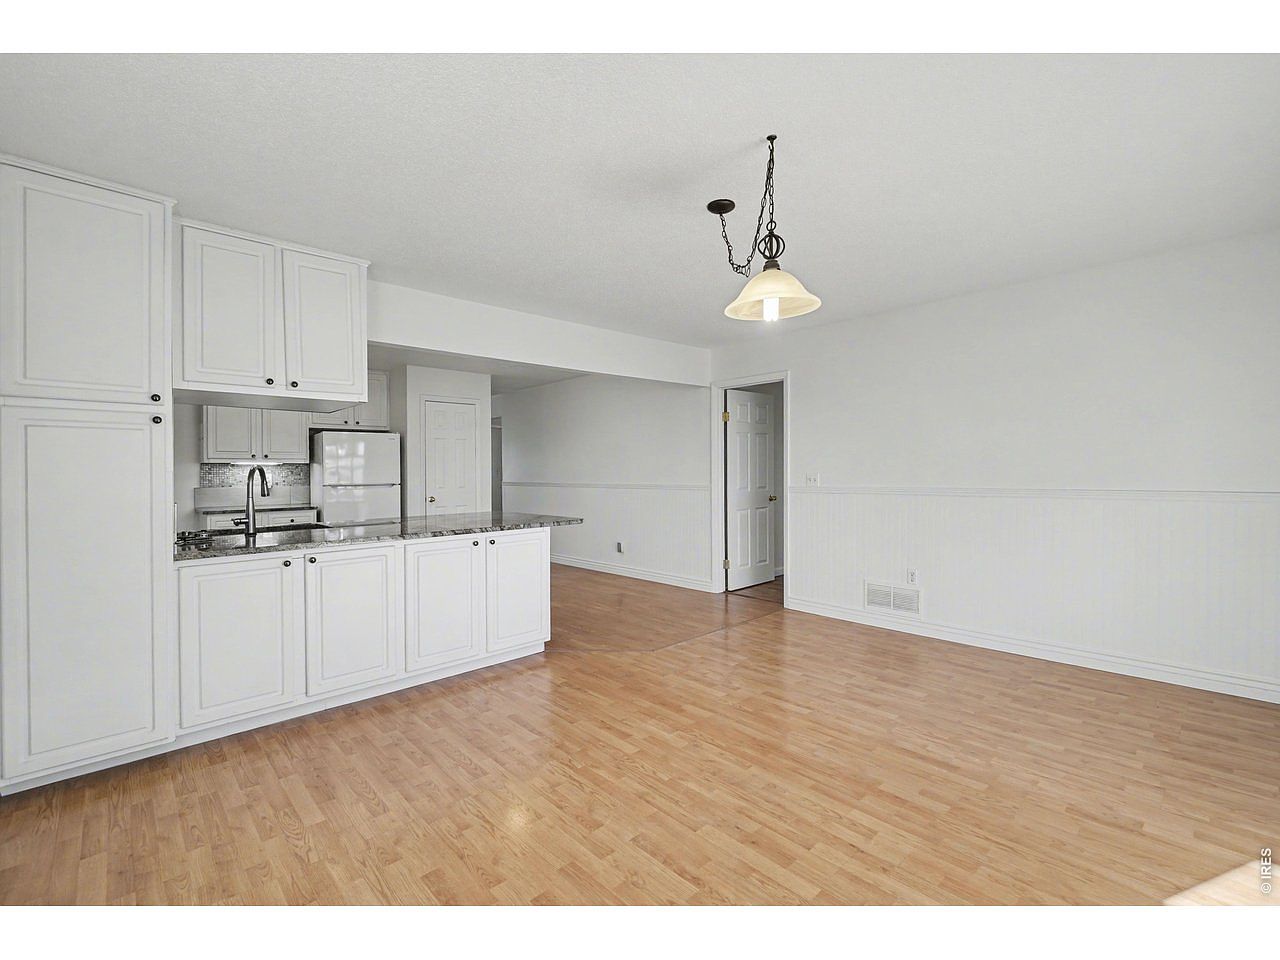
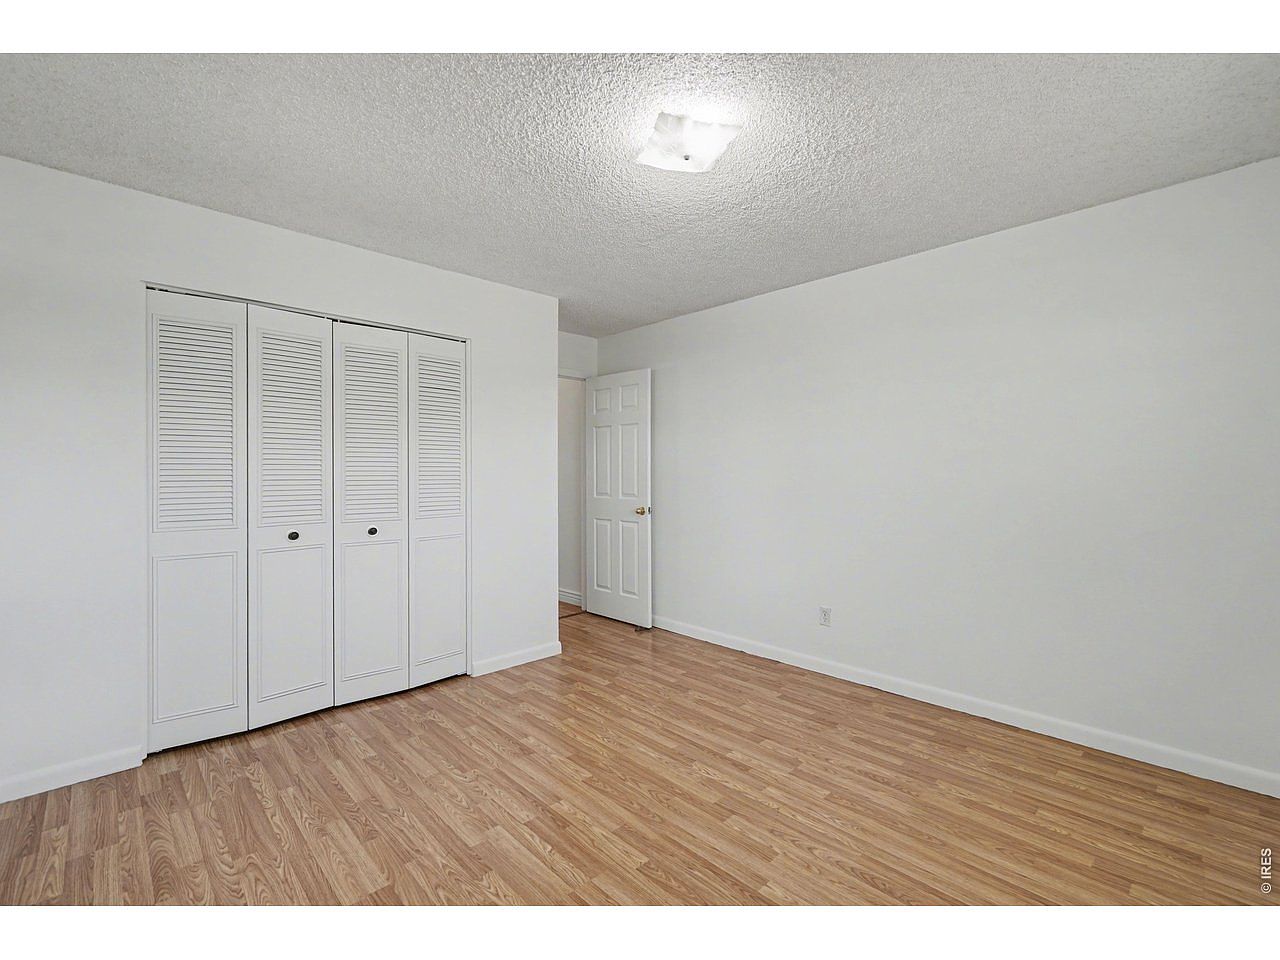
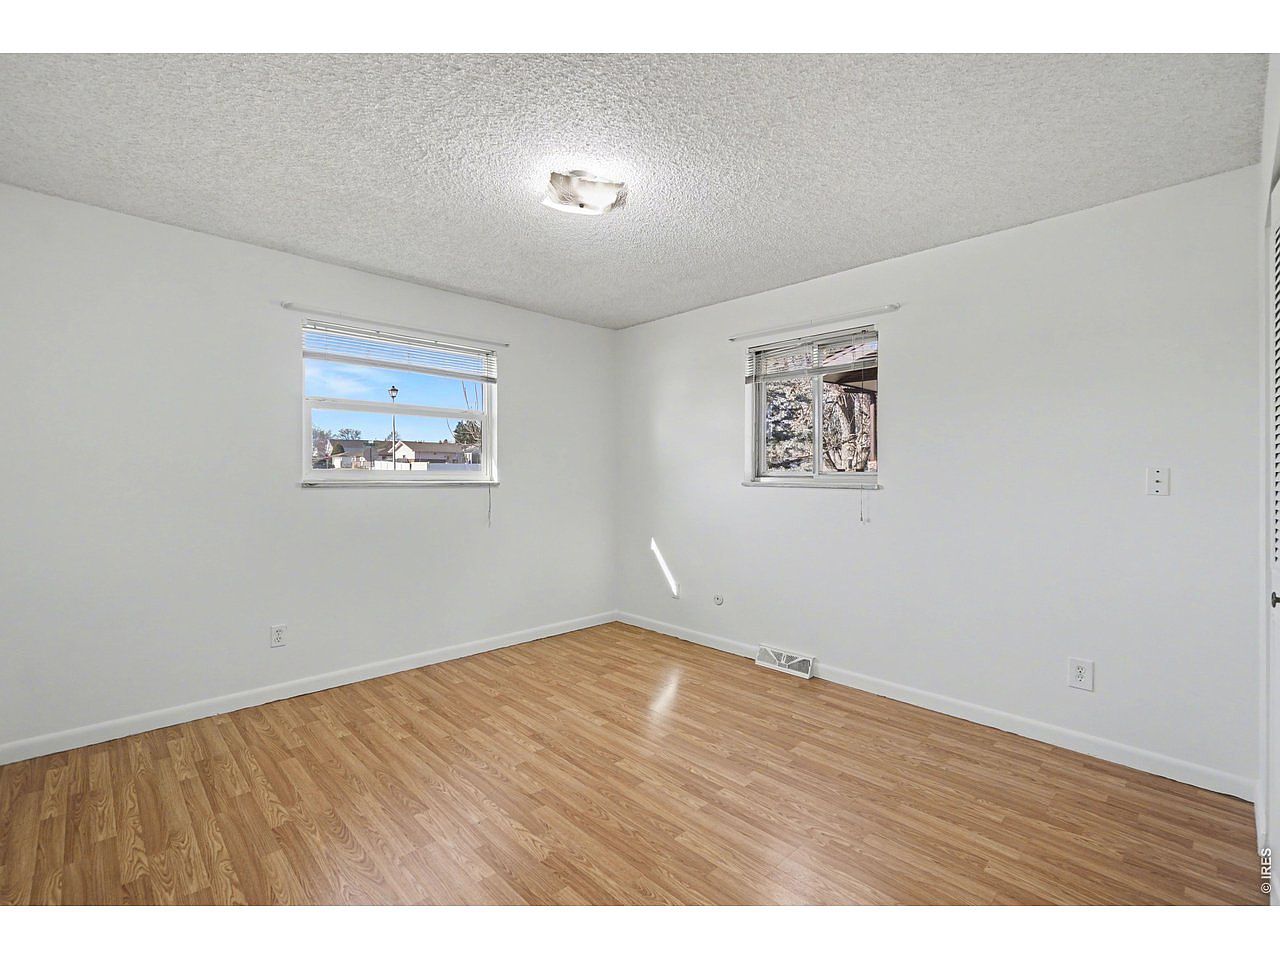
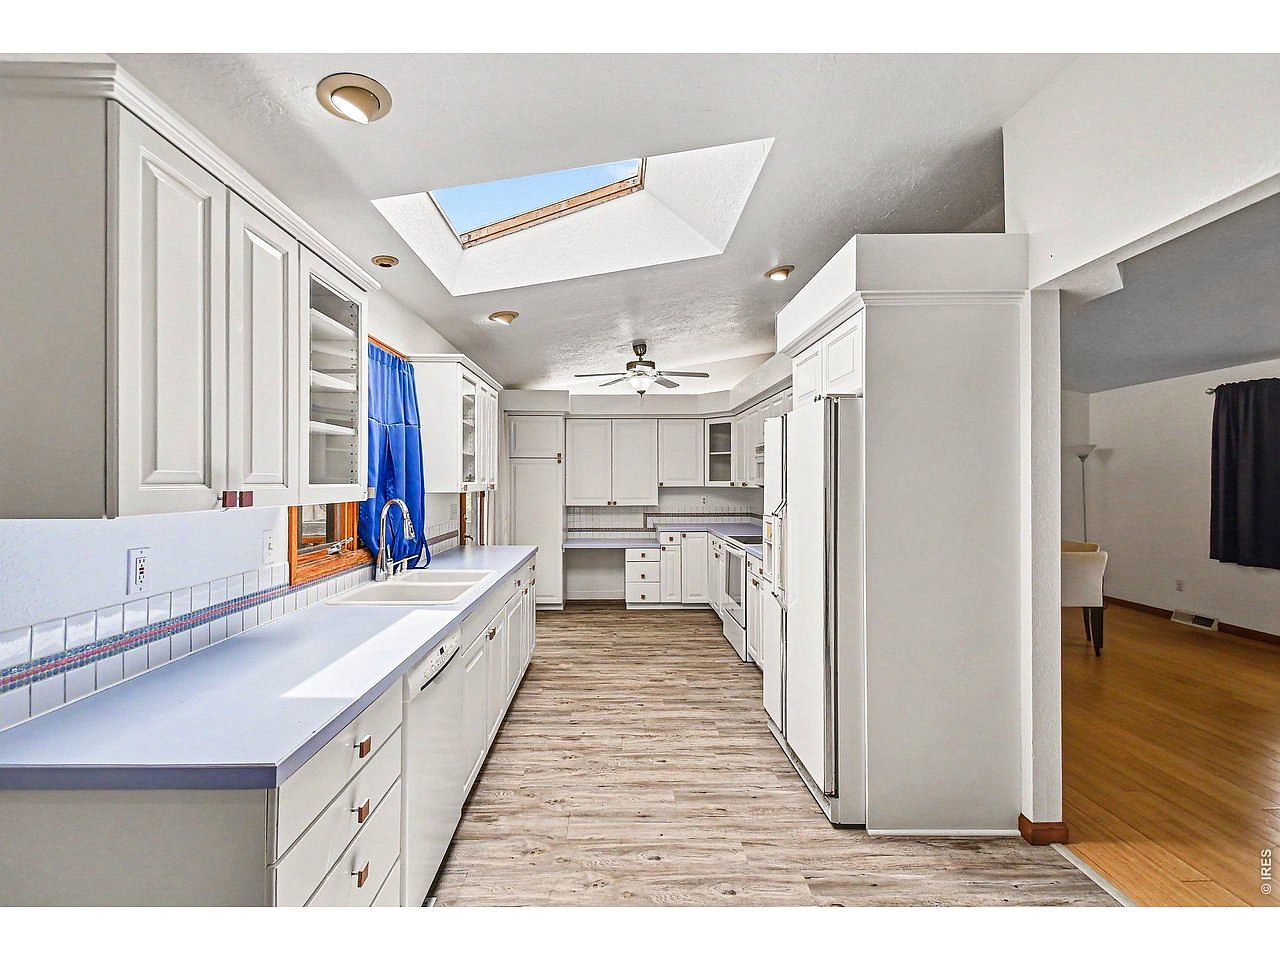
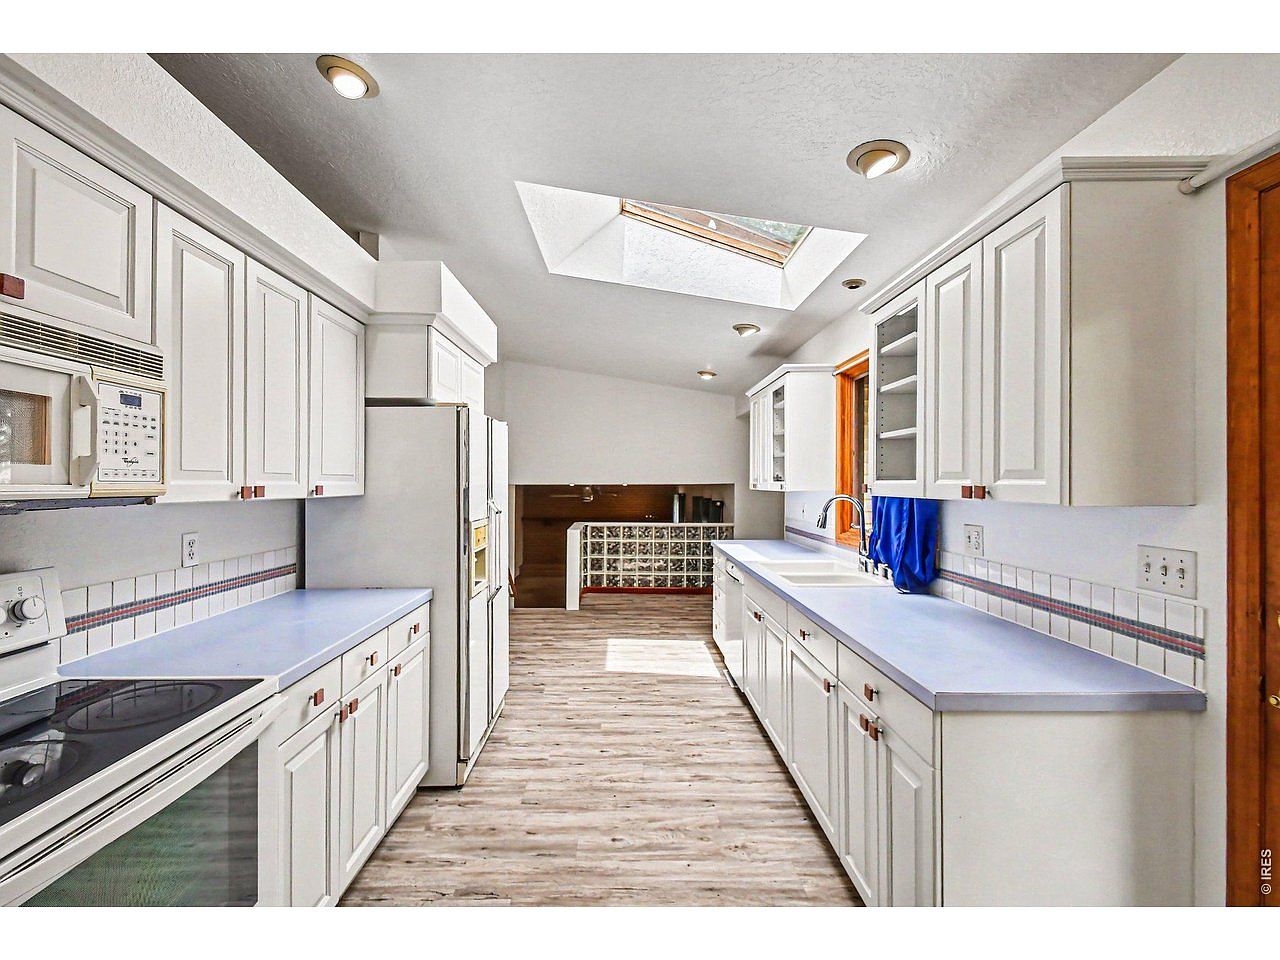
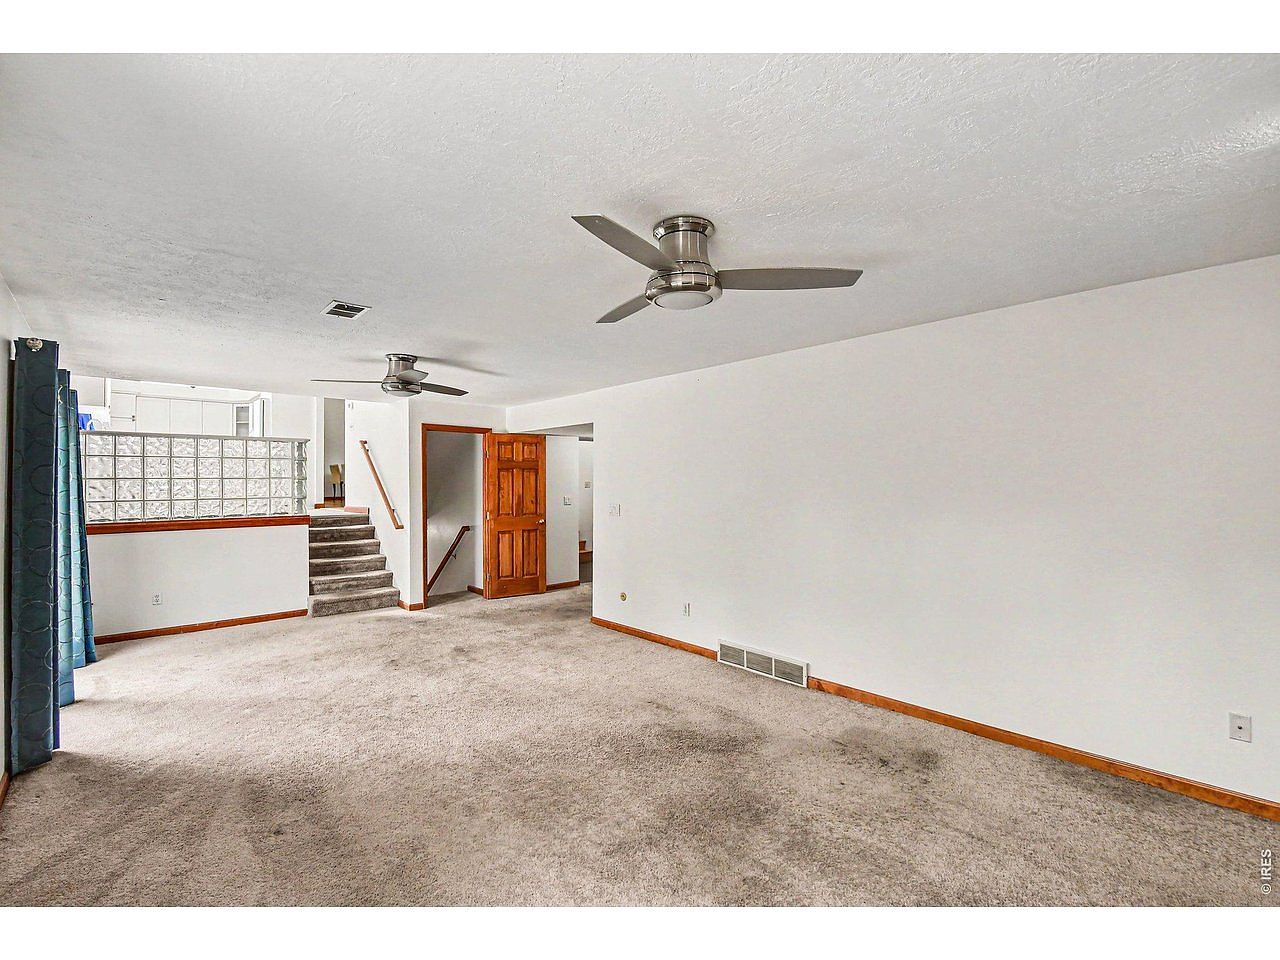
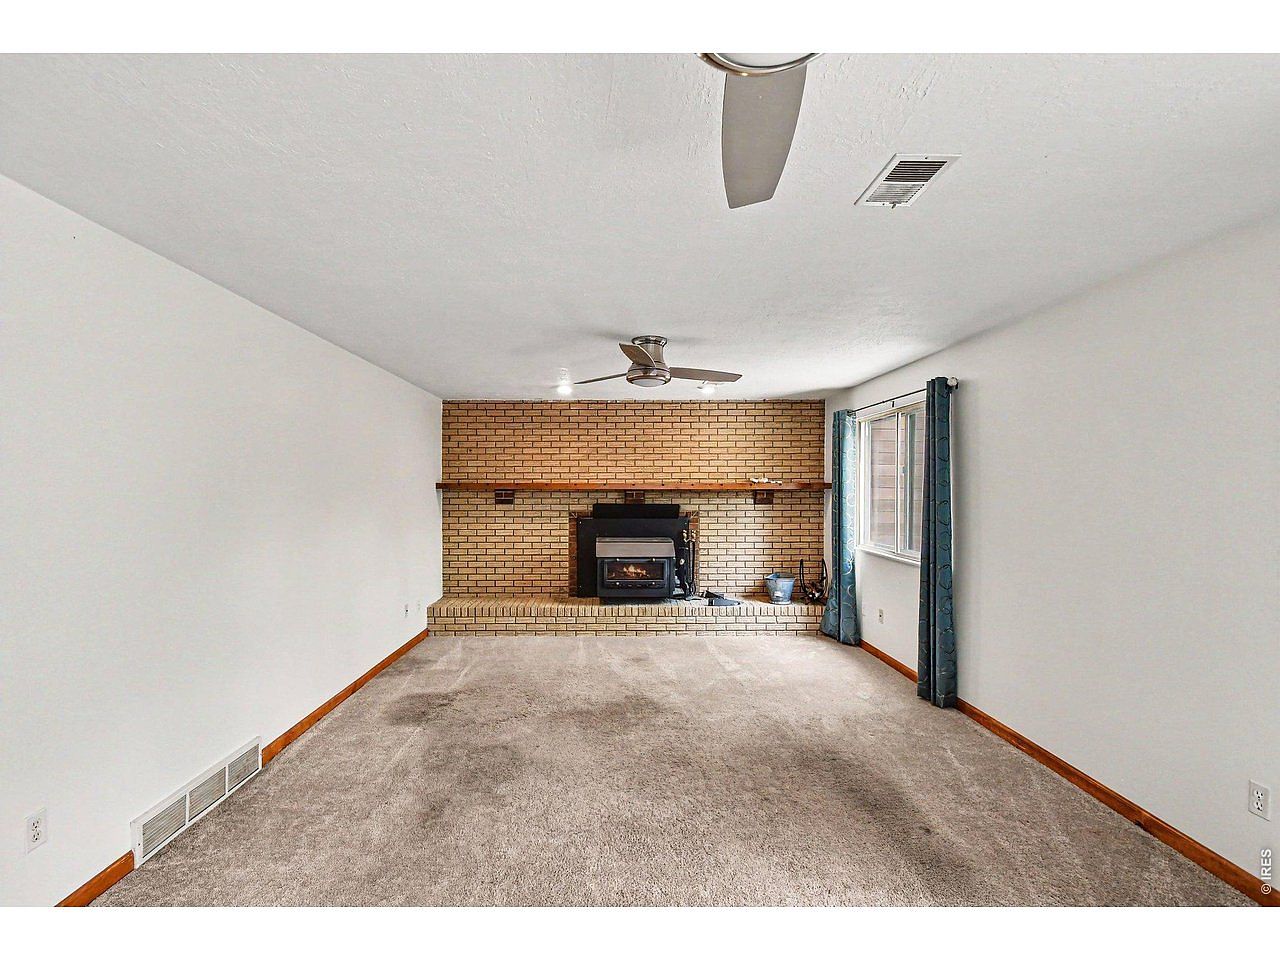
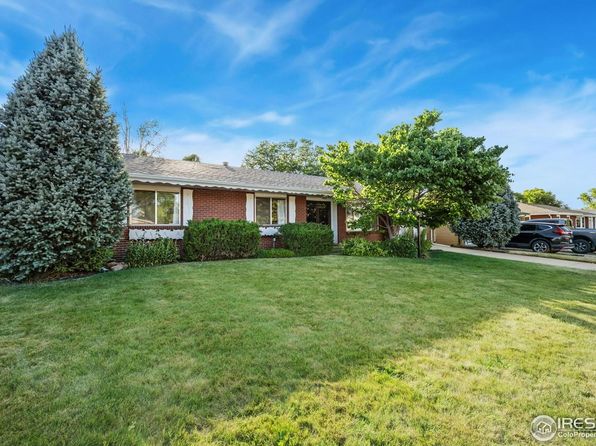
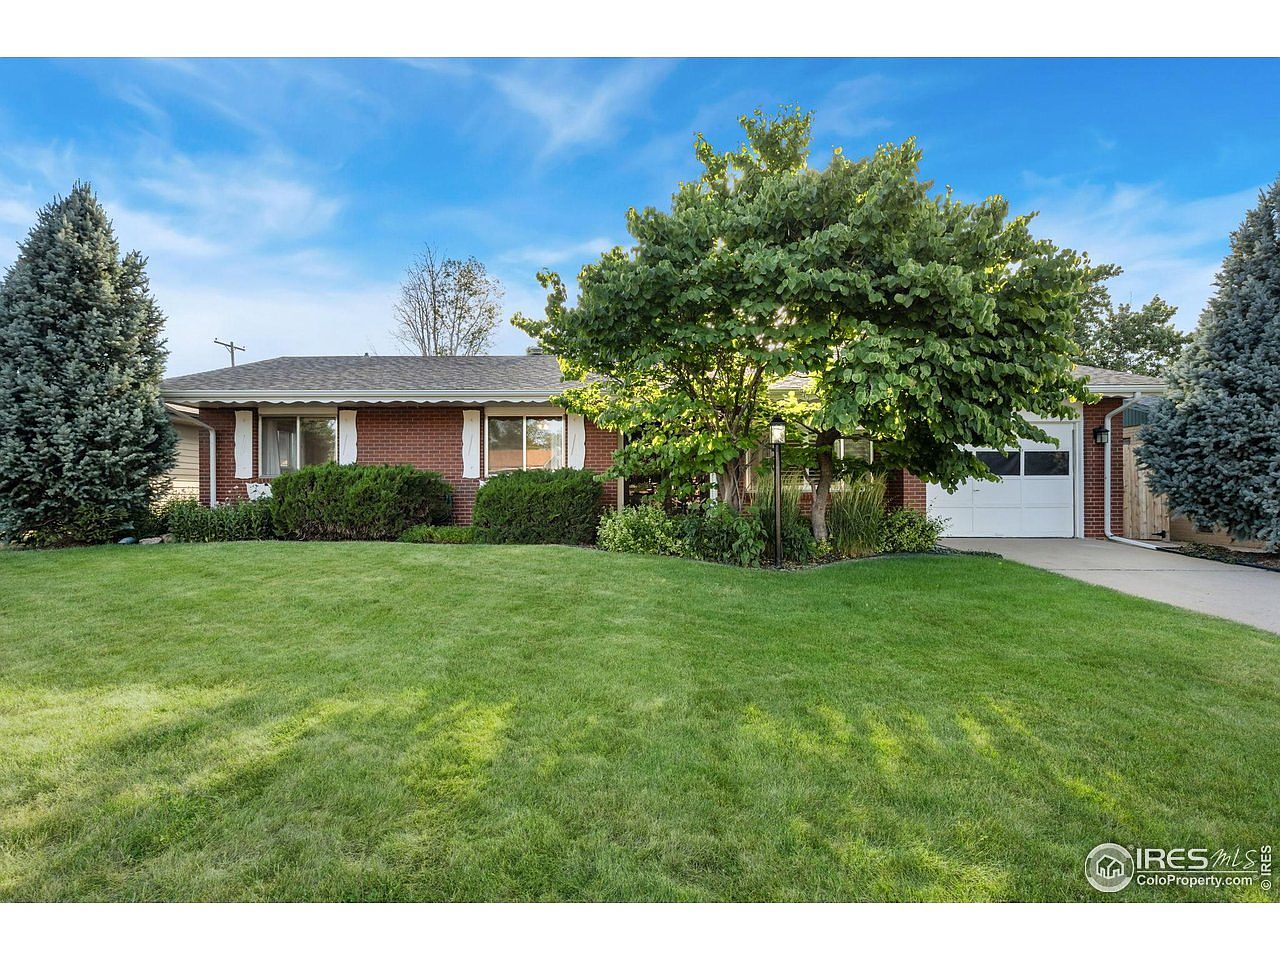
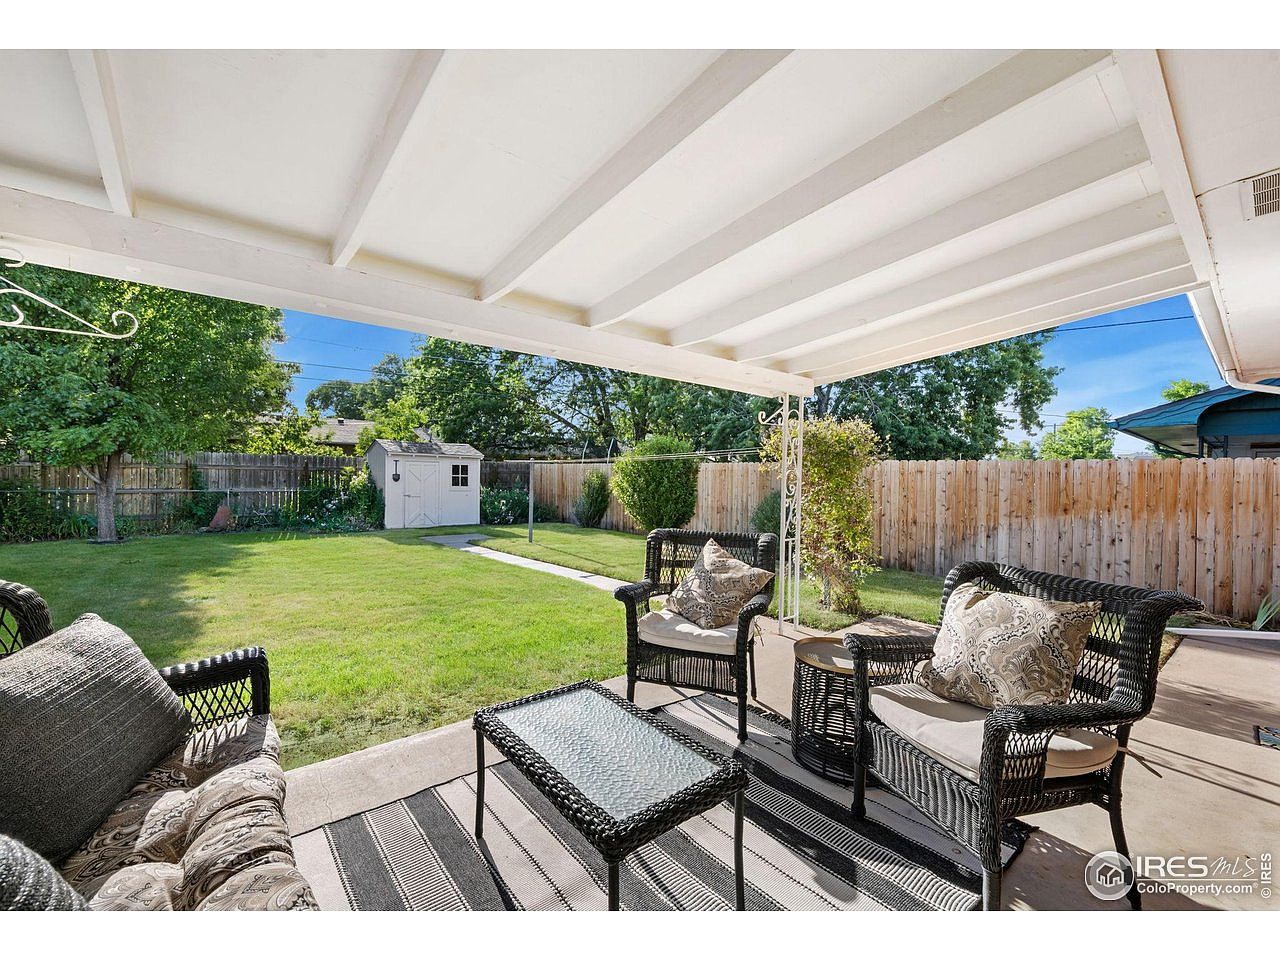
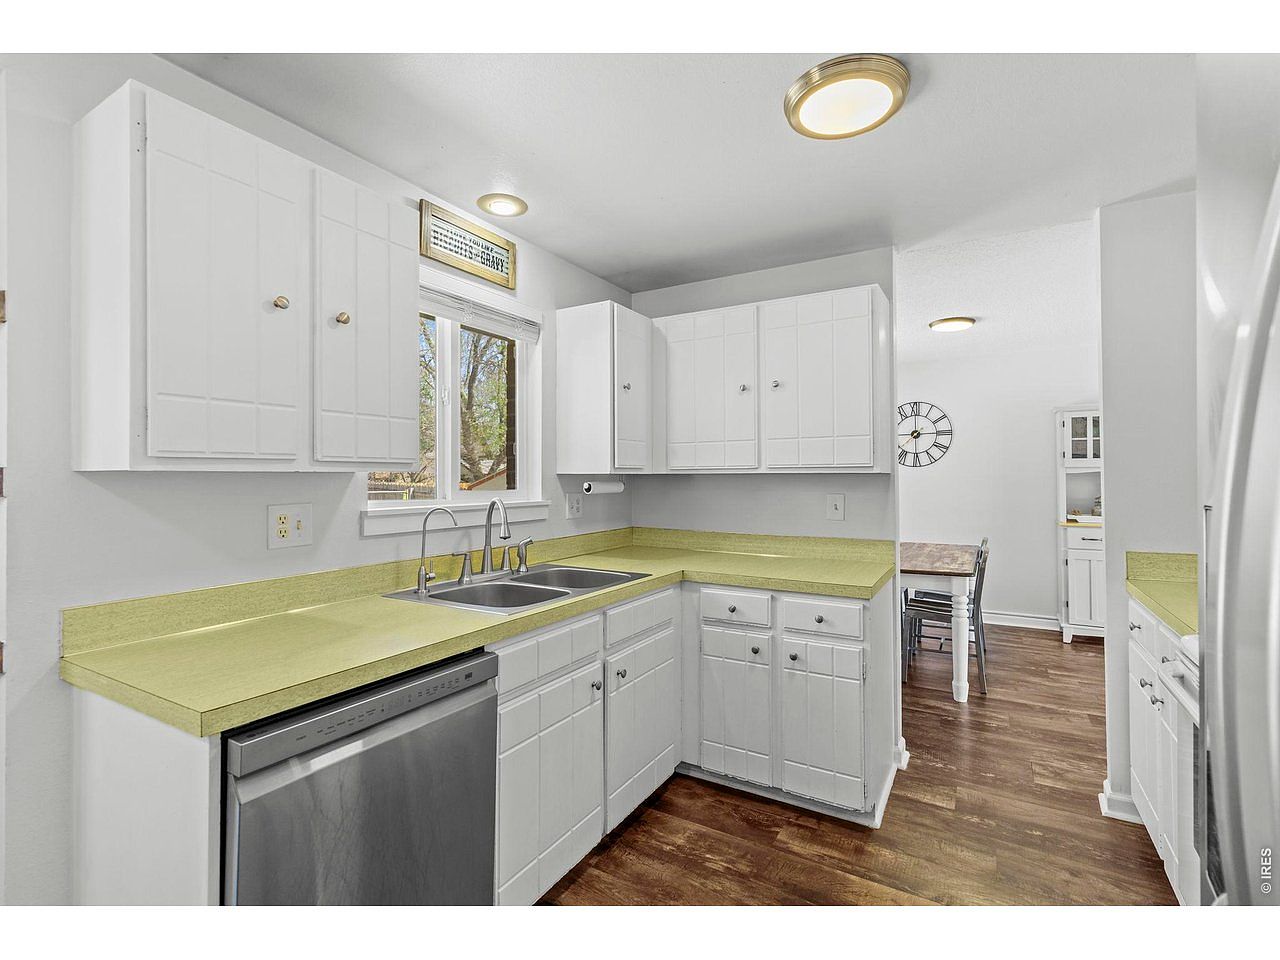
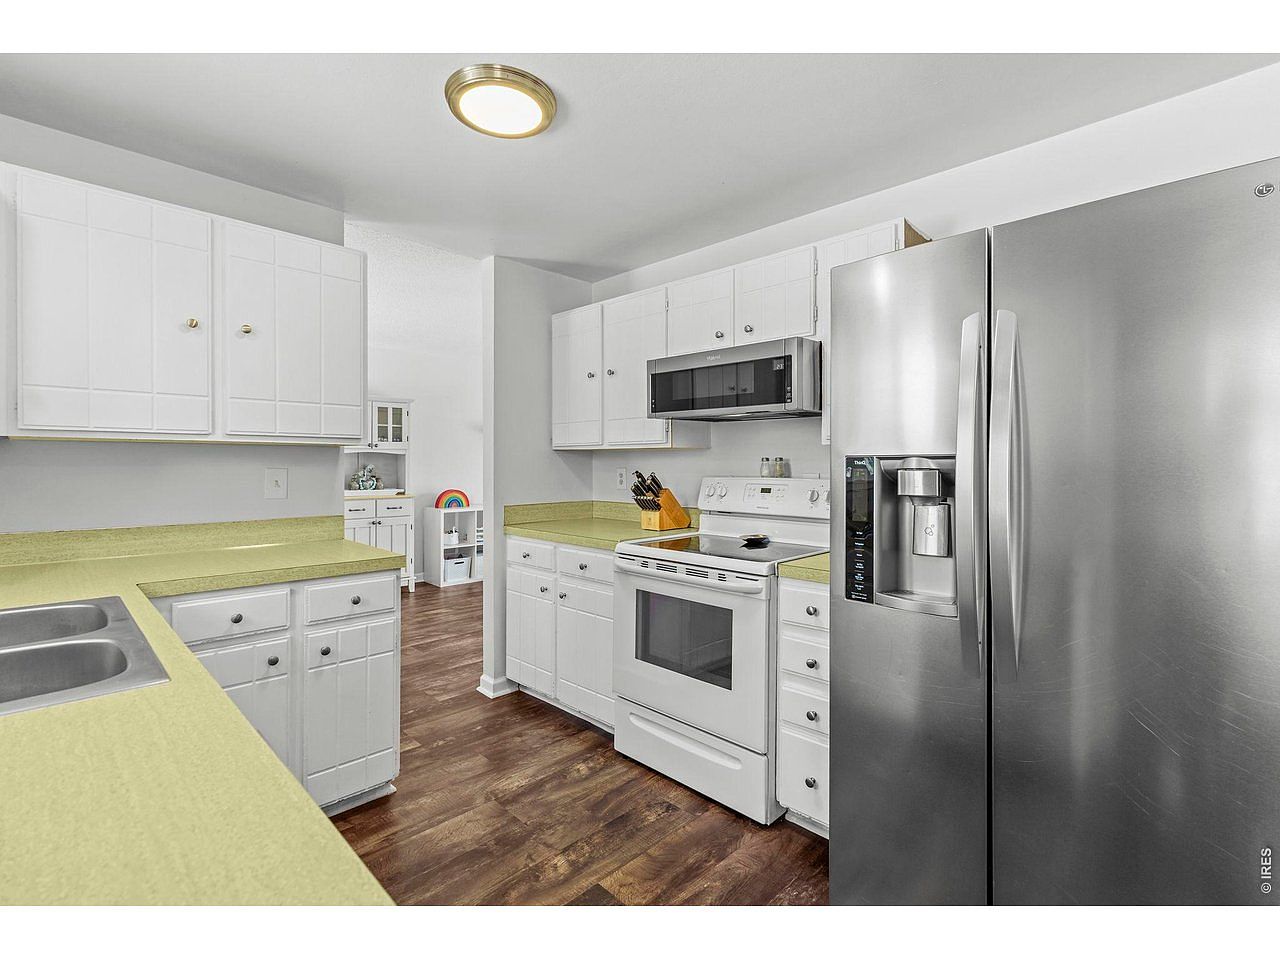
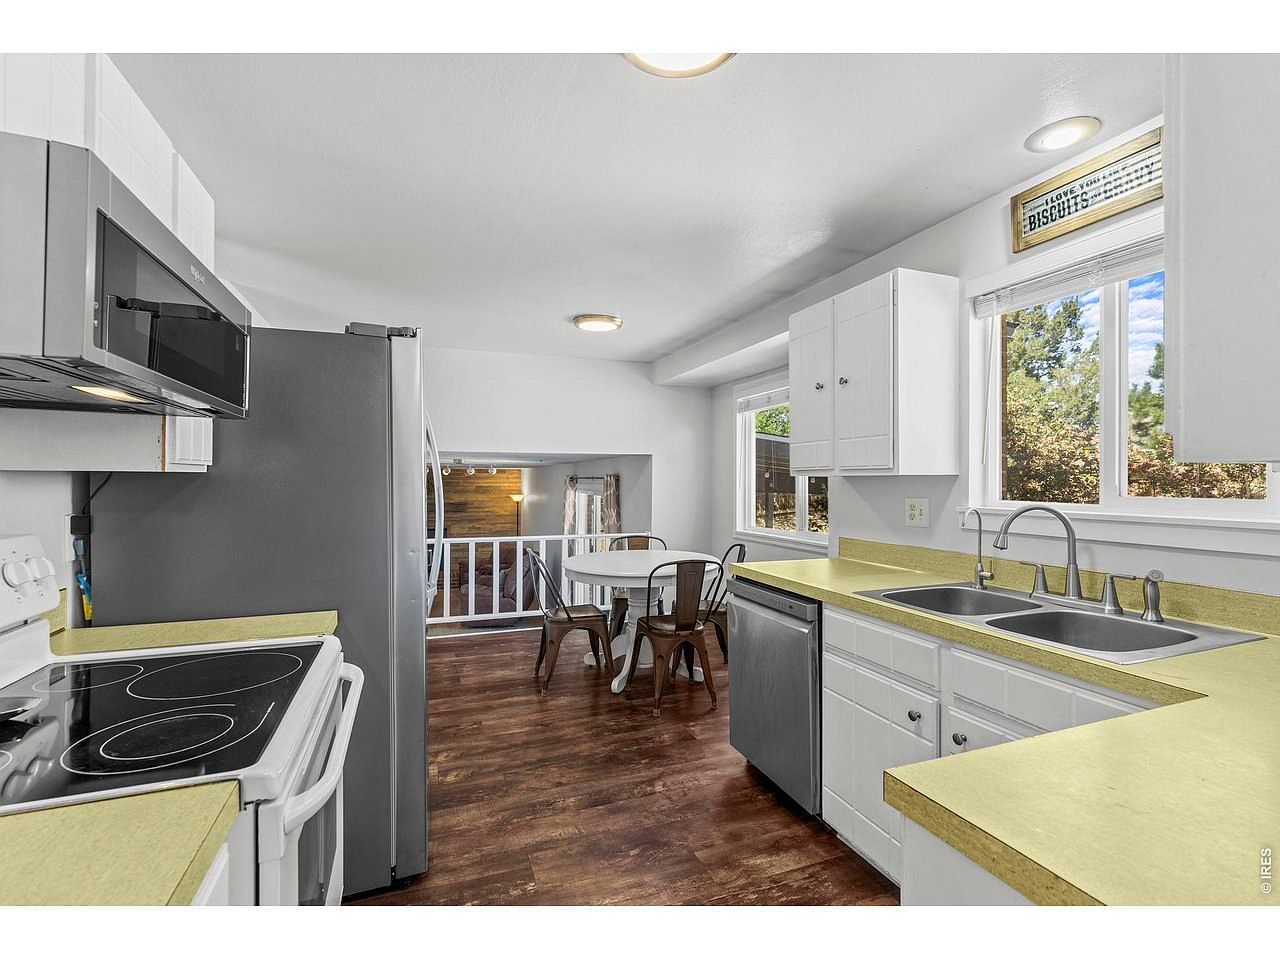
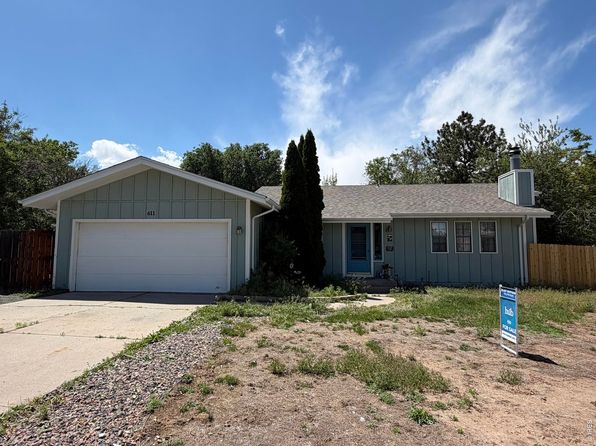
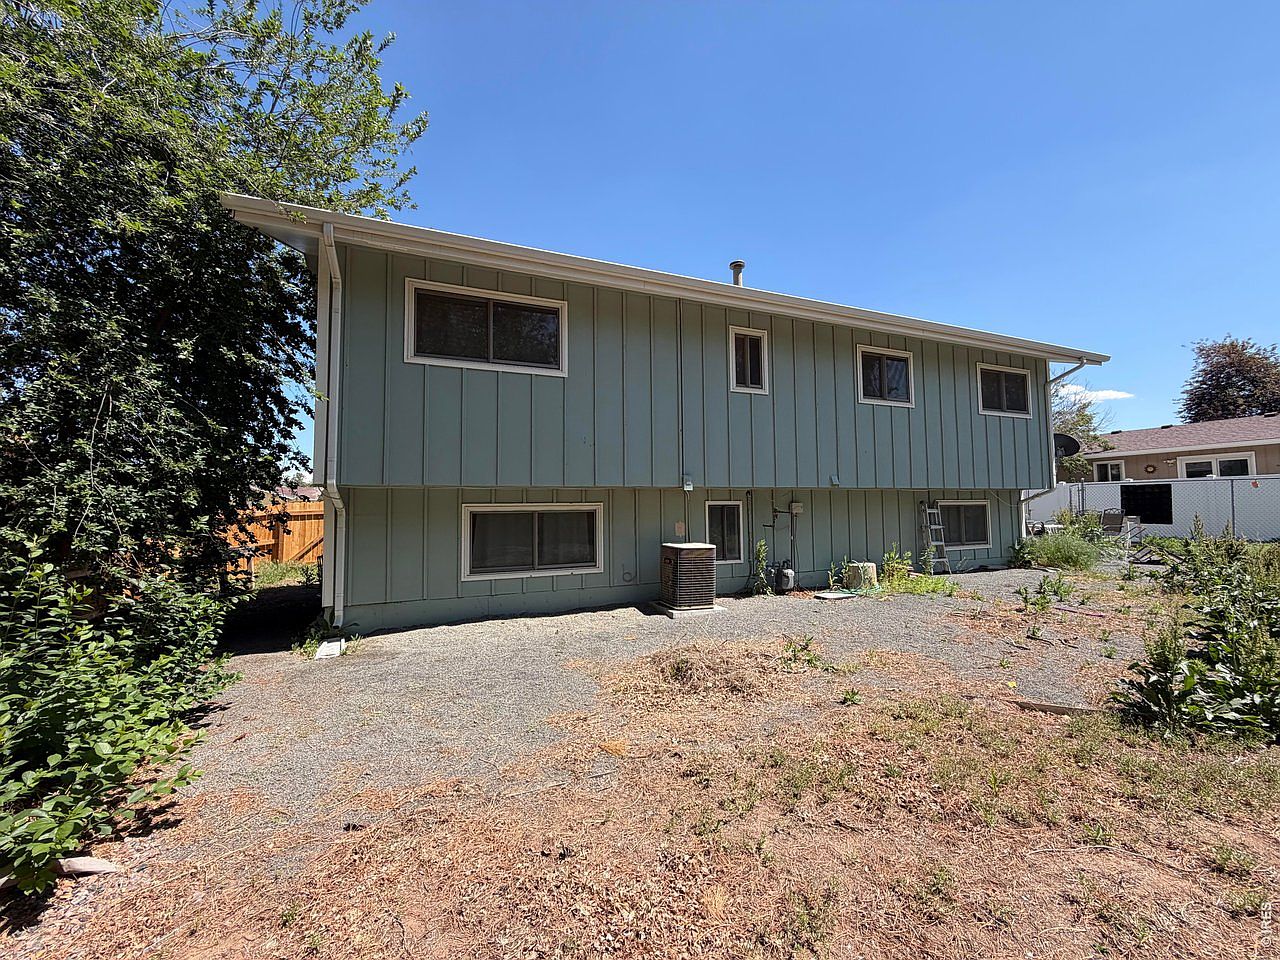
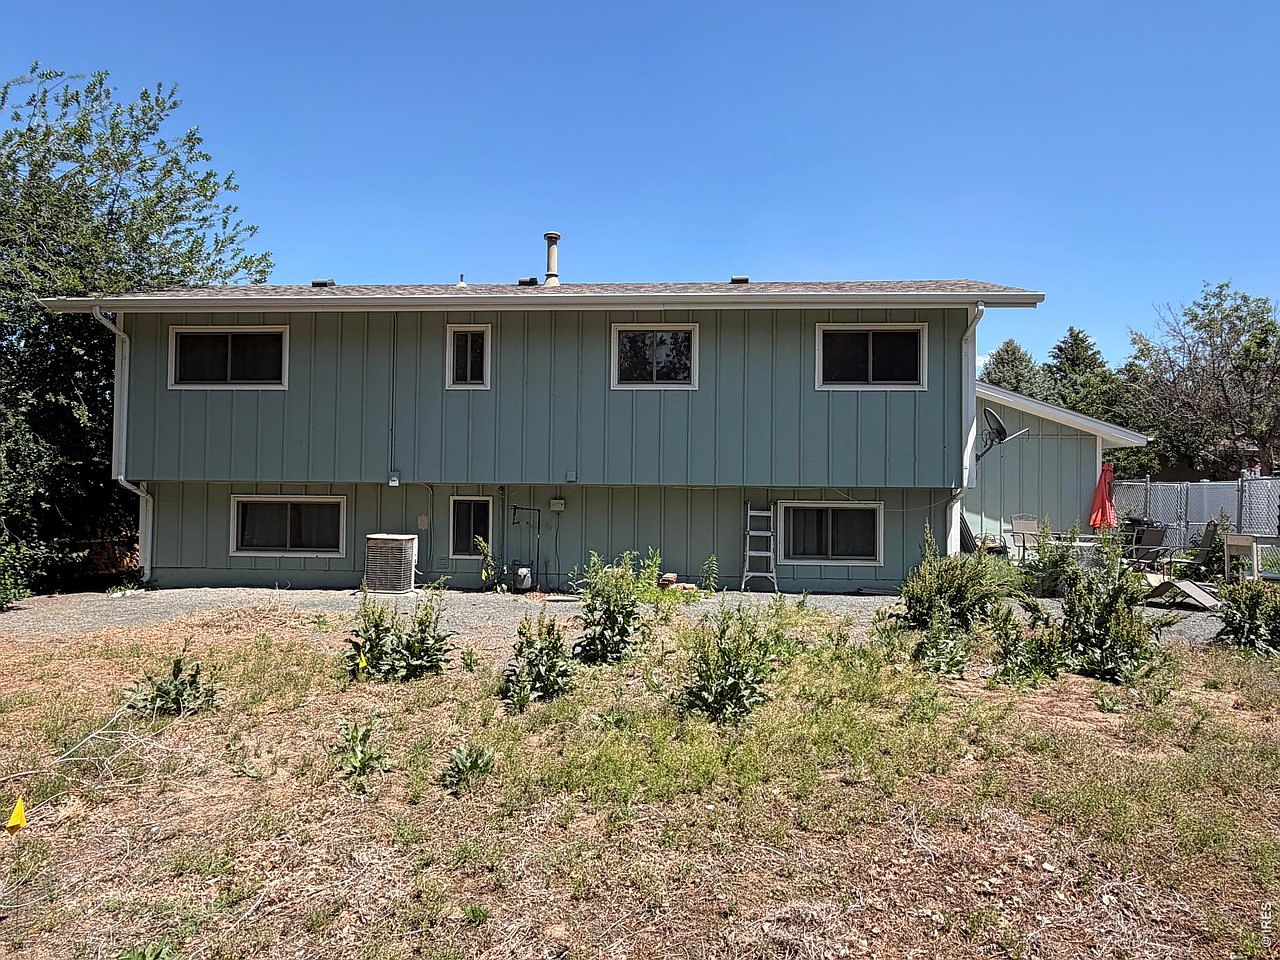
Custom market fit to your home — size, beds, baths, garage, lot size, and location.
2
Supply and Demand
How many homes are for sale versus how fast they sell. That balance is who has leverage.
3
Your Competition
Active, available homes — the ones a buyer can actually go see. Pending and backup are already spoken for.
4
Three Levers — Price, Condition, Location
That’s what buyers compare. You can’t move the house. You can still change the asking price, and improve the condition.
5
Providing Value or Are the Value
If a similar home lists under you, they’re providing the value — they look like the better buy next to yours. If they list over you, you are the value. Same kind of house; the ask is what makes one of you look like the deal.
6
Pricing Determines Time to Contract
The asking price is what determines how long it takes to go under contract. Priced with the market, homes here move. Overpriced listings linger — and help sell everyone else’s house.
1Homes on the MarketStrong Seller's Market · 2.2 mo inventory
Your competitive market
West Greeley · similar homes
Greeley2 ZIP codes~24 mo history946–2,798 sq ft2–6 bed1–6 car · mostly 2
Agent criteria: Public sample listing — start a free trial to run your own MLS export.
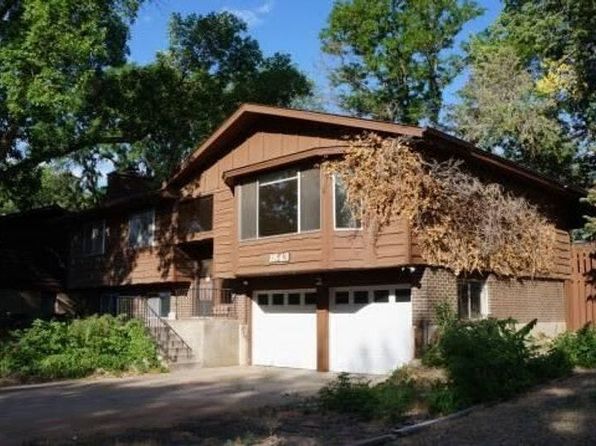
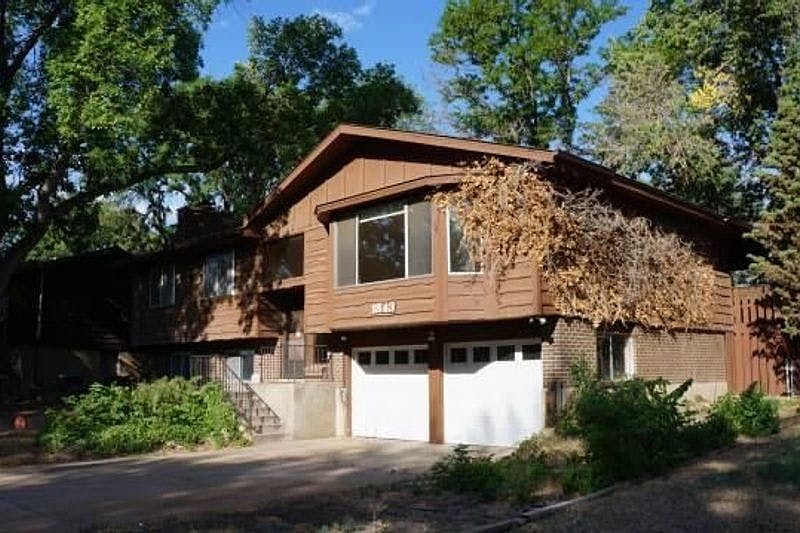
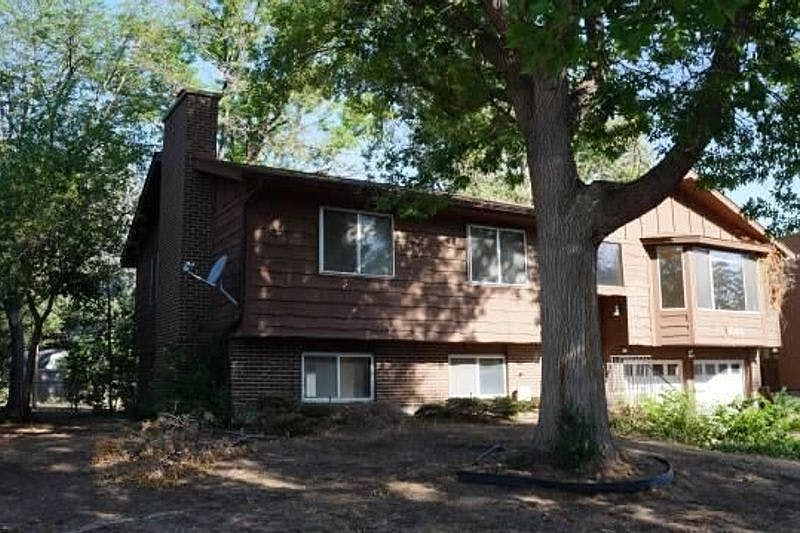
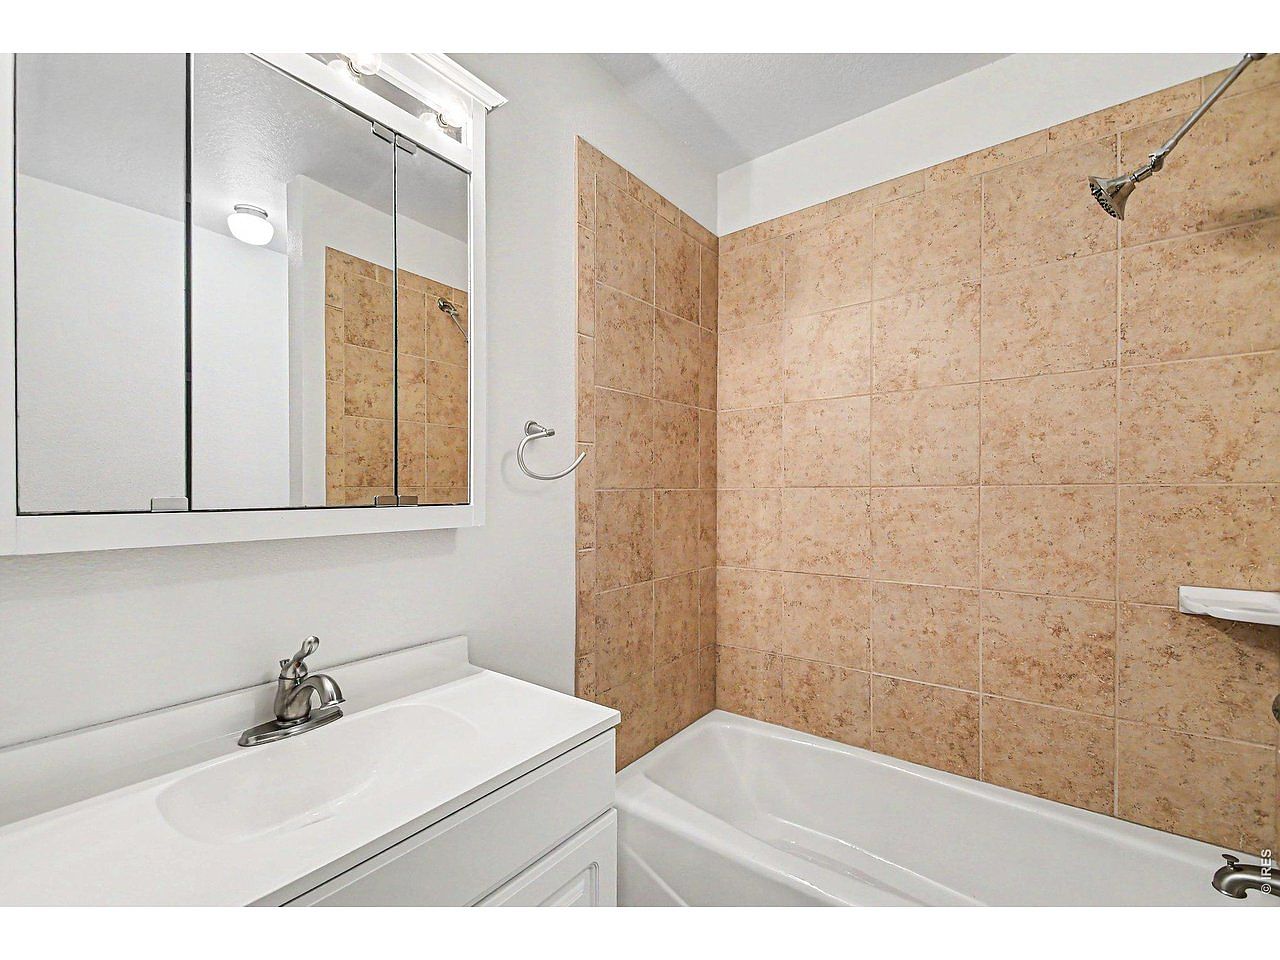
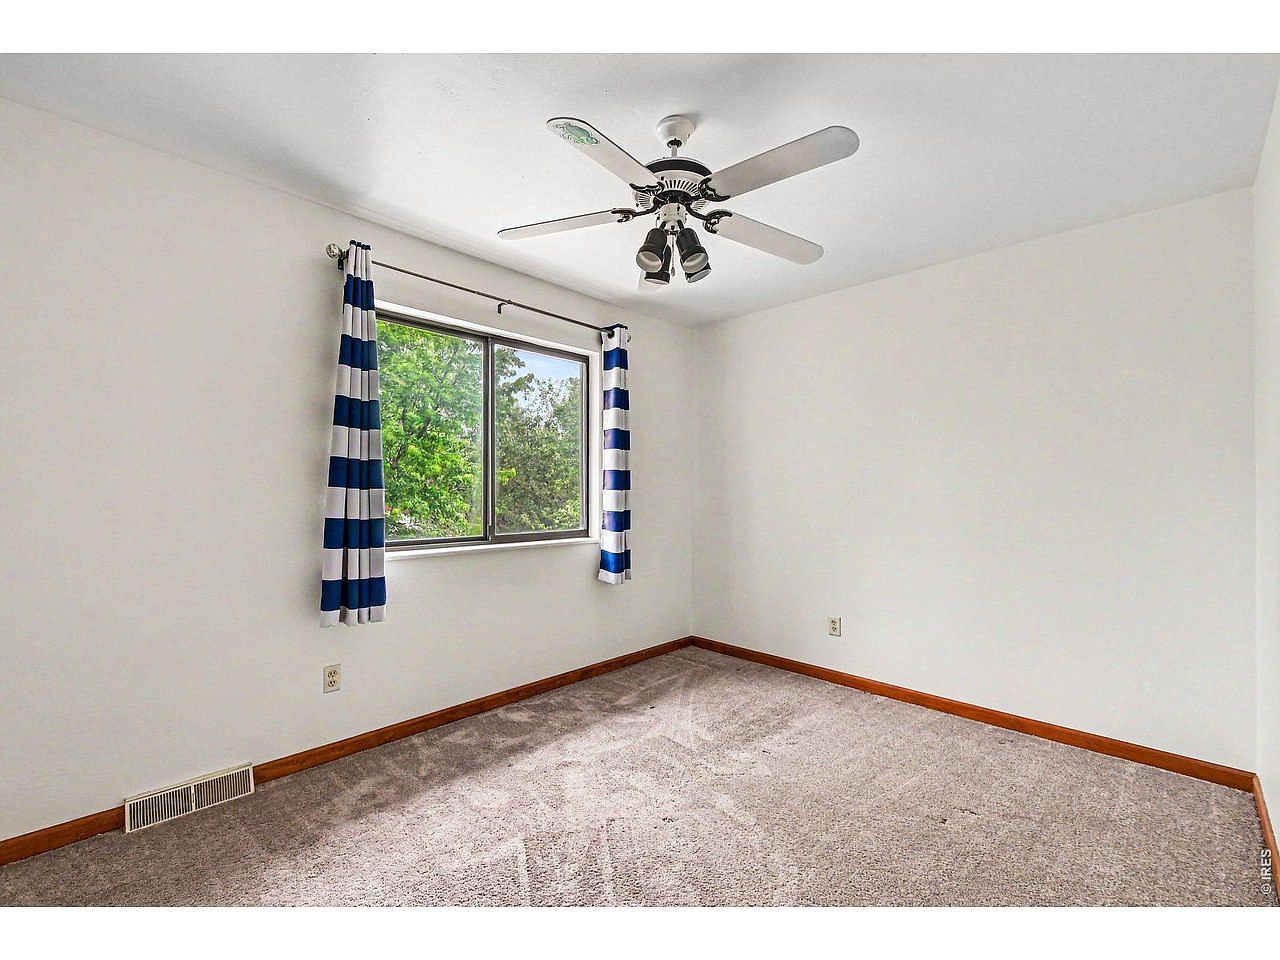
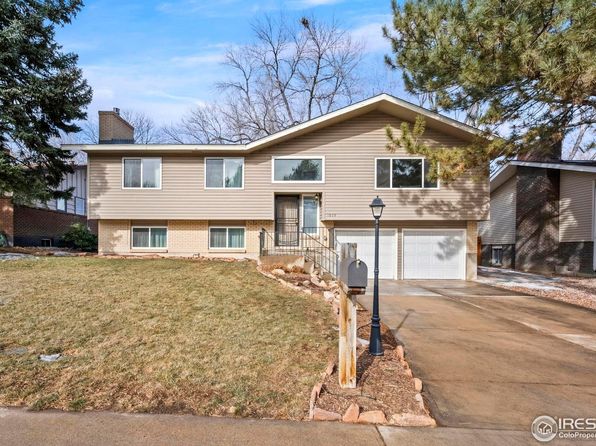
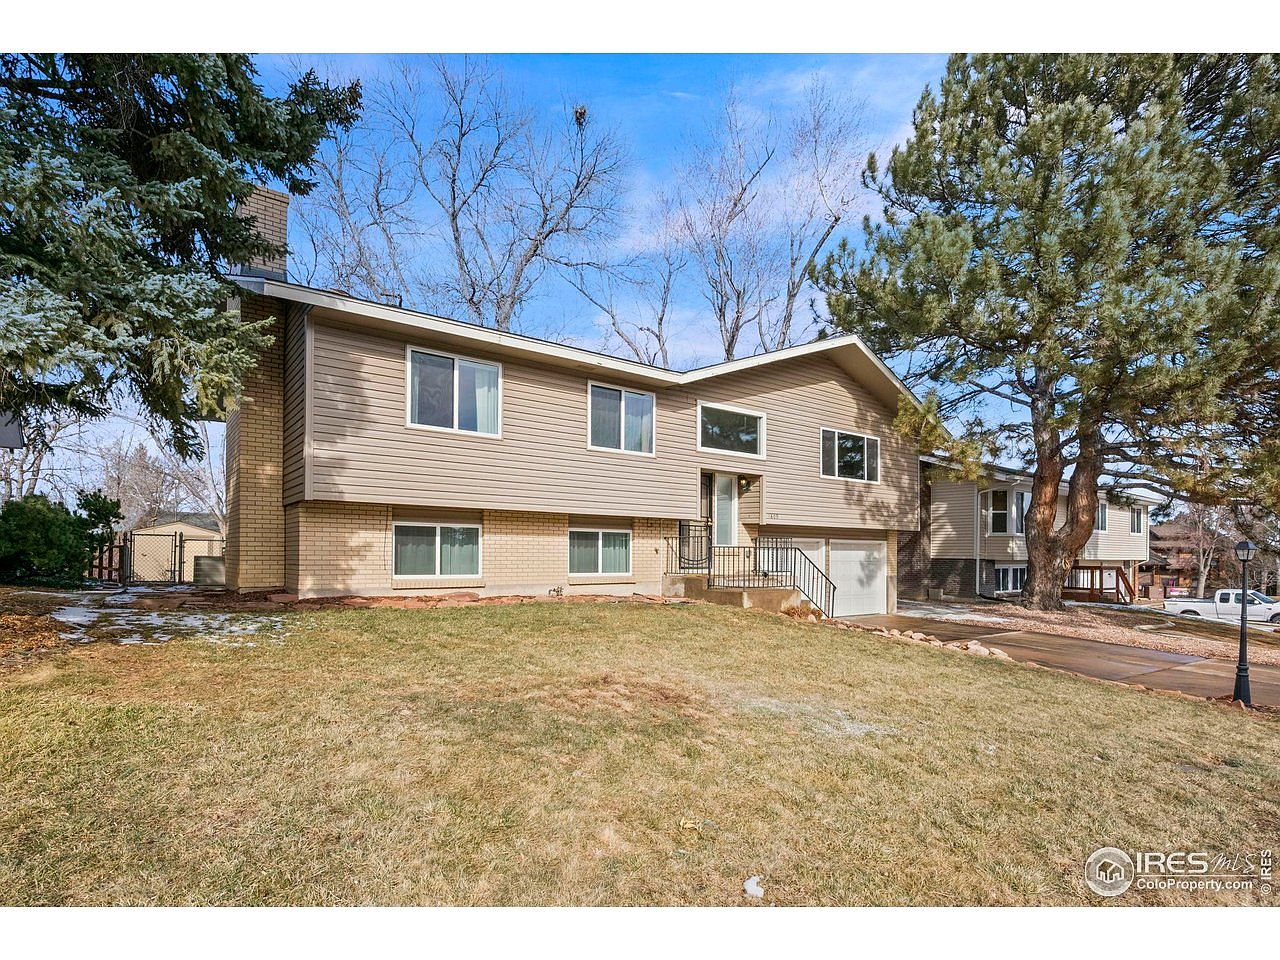
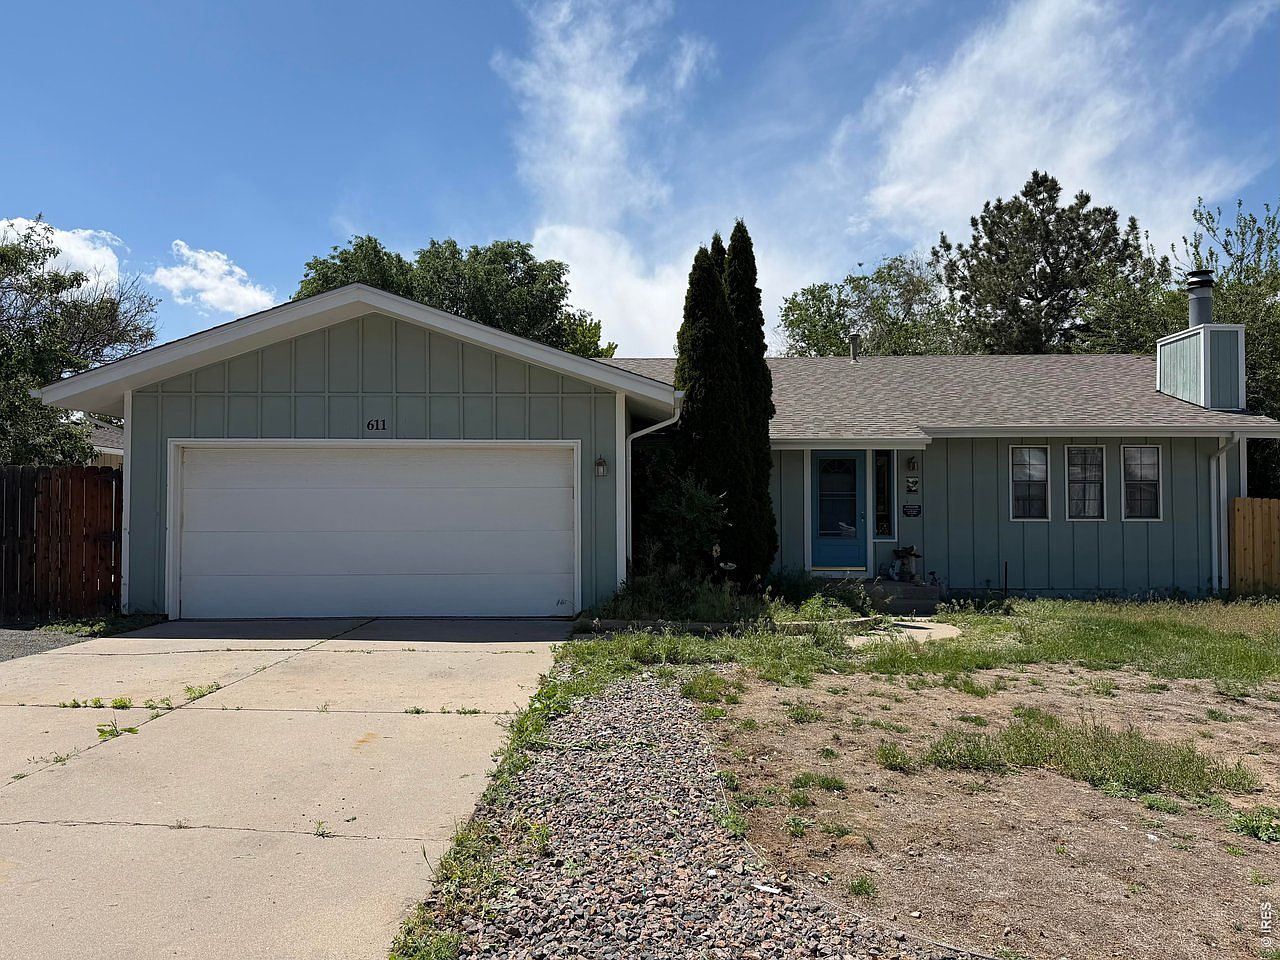
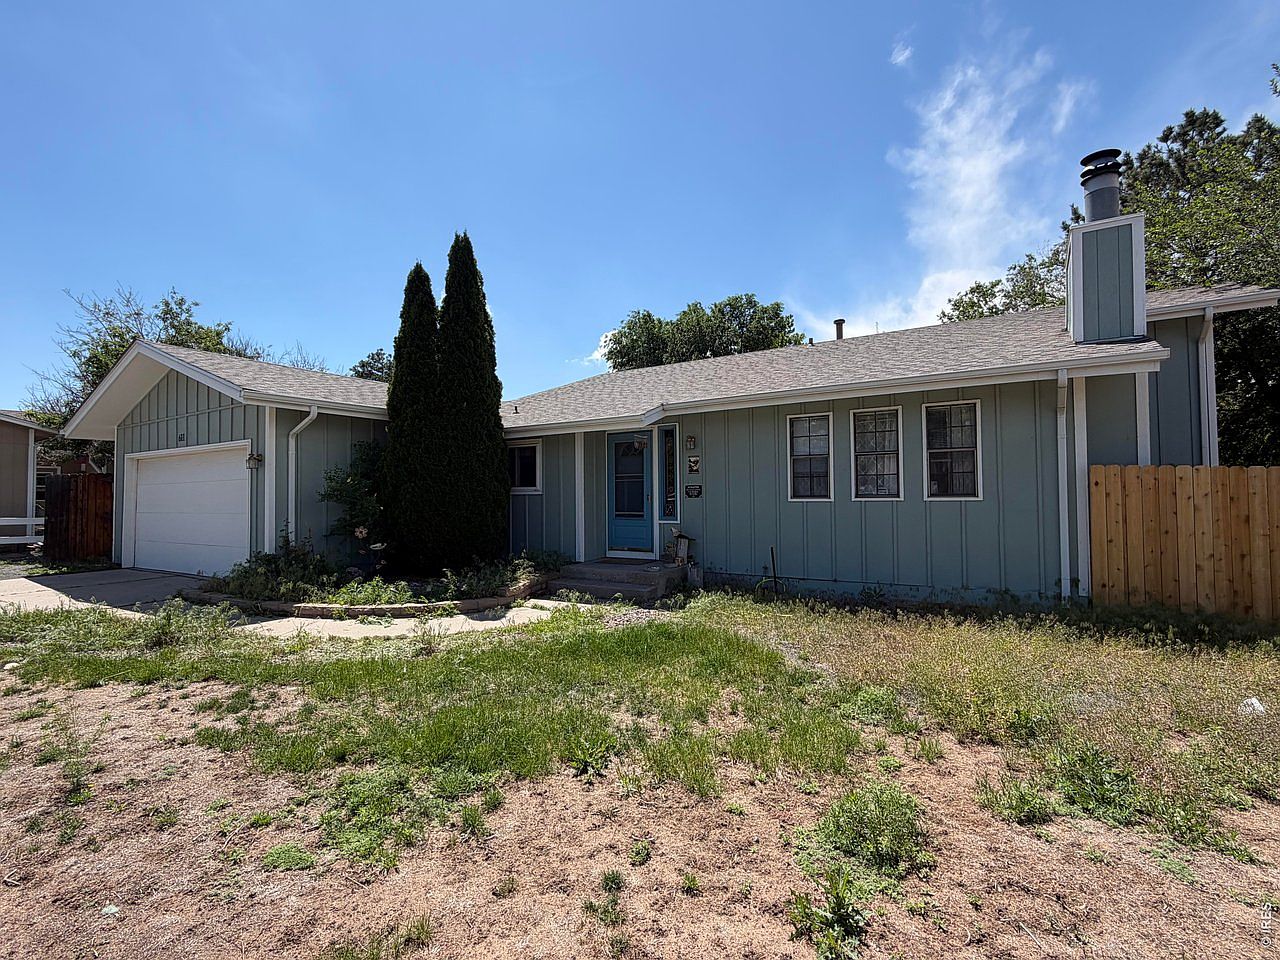
Your home: 2,392 sq ft · 4/2 · 2-car · built 1969
Competition = Active only. Pending + Backup are under contract — already spoken for, not inventory.
24
Active on Market
25
With Your Home Included
How Long Should It Take?
Well-priced homes in this segment typically go under contract in about 46 days (median DOM).
What Are the Odds?
A well-priced new listing has about a 46% chance of going under contract in any given 30-day window at 2.2 months of inventory.
When Is the Market Most Active?
Recent sales pace is 11.1/month; the busiest recent month was December 2025 (19 sales).
Active Competition by List-Price Band
Where today’s Active homes sit by asking price — the highlighted band is the market-supported value line from comps.
At $410,000, buyers comparing Active homes in your band see about 7 competing lists (of 24 Active overall).
18
Under Contract
11.1
Sales / Month
2.2
Months of Inventory
46%
30-Day Market Odds
257
Recently Closed
69
Didn't Sell ?
69 did not sell (71 expired · 5 withdrawn). Excludes 7 that came back within 45 days.
7
Back on Market Soon ?
7 left the market and returned within 45 days — set aside so they are not counted as true “didn’t sell.”
$400k
Median Sold Price
46
Median Days on Market
$197
Median $ / Sq Ft
2The Supply StreamSupply Is Building · 1.37×
Active competition is a snapshot. The supply stream is the pipeline — new homes that keep arriving while yours sits versus how fast they sell.
New Listings vs Sales · Recent Pace
15.2
New / month
11.1
Sales / month
New listings 58%Sales 42%
building
Supply Is Building
New listings are arriving faster than this segment clears — inventory pressure rises while a home sits.
1.37×
Supply pressure
+4.1
Net / month
New Listings vs Closed Sales by Month
When the blue bars run ahead of navy, inventory is building in this competitive set.
About 15.2 new listings per month vs 11.1 sales per month (supply pressure 1.37×). New listings are arriving faster than the market clears.
3Closest Comparable Sales
Ranked by similarity to your home — size, beds/baths, age, garage, and how recently it sold, inside a comp-supported price band. Tap a home for the full gallery.
How comps are ranked
Auto picks score every sold home in this market against yours. Living area carries the most weight, then beds, year built, baths, and garage. Recent sales beat older ones. Extreme price outliers that match size but not the product get filtered out. The match % is relative to the best comp on this report — #1 is always the closest fit.
Auto picks · closest sales for this home
1 / 5
Your home
Anchor · compare the sales
Subject
1843 24th Ave Ct
Your home
Sq ft 2392
Bd / Ba 4 / 2
Year · Gar 1969 · 2
Role Yours
1 / 14
$400,000
Sold 2026-06-05 · -72 sf
Sold lower
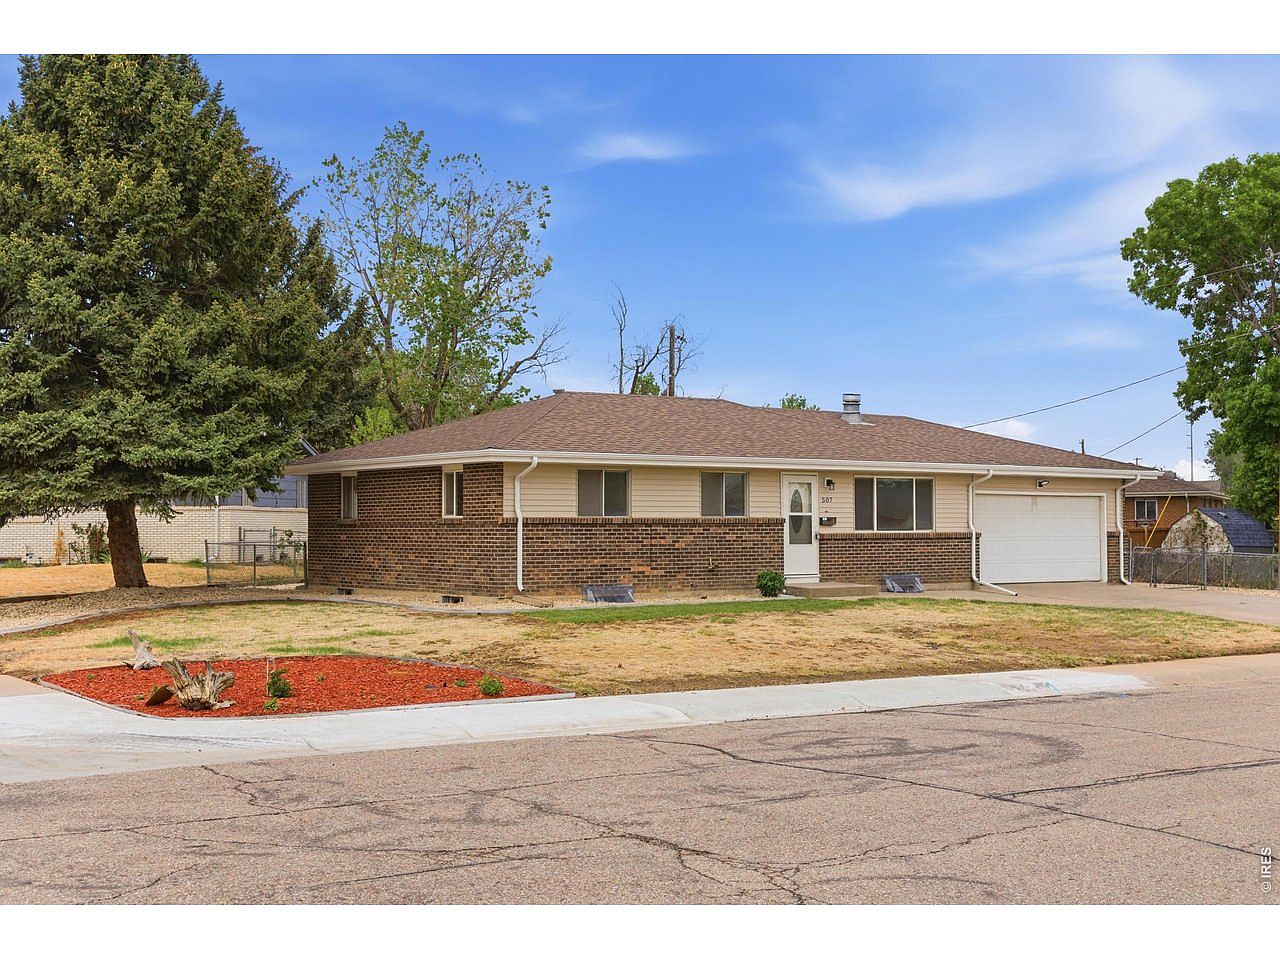
507 31st Ave
#1 · 99% match · MLS 1058635
-72 sqft · same bed/bath · same era · same garage
Sq ft 2320
Bd / Ba 4 / 2
Year · Gar 1969 · 2
DOM · $/SF 29d · $172
1 / 13
$415,000
Sold 2026-07-06 · -174 sf
Sold higher
3711 W 7th St Rd
#2 · 96% match · MLS 1055502
-174 sqft · same bed/bath · same era · same garage
Sq ft 2218
Bd / Ba 4 / 2
Year · Gar 1972 · 2
DOM · $/SF 95d · $187
1 / 14
$415,000
Sold 2026-07-02
Sold higher
502 46th Ave
#3 · 82% match · MLS 1060462
similar size · 4/3 bed/bath · +9 yrs · same garage
Sq ft 2420
Bd / Ba 4 / 3
Year · Gar 1978 · 2
DOM · $/SF 35d · $171
1 / 12
$425,000
Sold 2026-04-02 · -82 sf
Sold higher
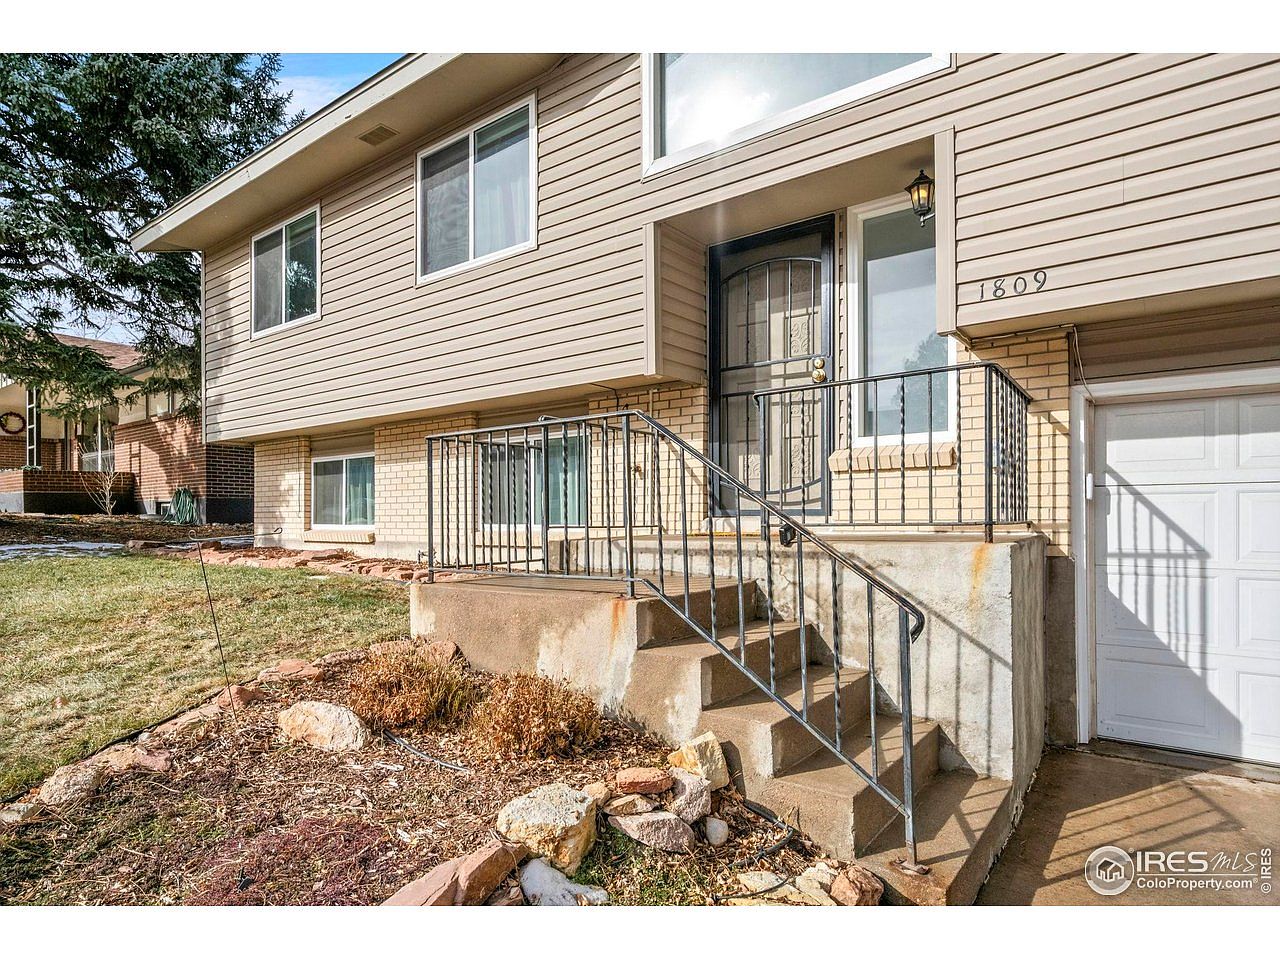
1809 24th Ave Pl
#4 · 80% match · MLS 1050778
-82 sqft · same bed/bath · same era · same garage
Sq ft 2310
Bd / Ba 4 / 2
Year · Gar 1967 · 2
DOM · $/SF 59d · $184
1 / 14
$445,000
Sold 2026-04-20 · +80 sf
Sold higher
1424 40th Ave
#5 · 72% match · MLS 1051172
+80 sqft · same bed/bath · +10 yrs · same garage
Sq ft 2472
Bd / Ba 4 / 2
Year · Gar 1979 · 2
DOM · $/SF 72d · $180
1 / 13
$420,000
Sold 2026-06-10
Sold higher
821 36th Ave
#6 · 70% match · MLS 1049396
similar size · 4/3 bed/bath · same era · sold 15 wks ago
Sq ft 2431
Bd / Ba 4 / 3
Year · Gar 1964 · 1
DOM · $/SF 150d · $173
1 / 14
$460,000
Sold 2026-06-05 · -65 sf
Sold higher
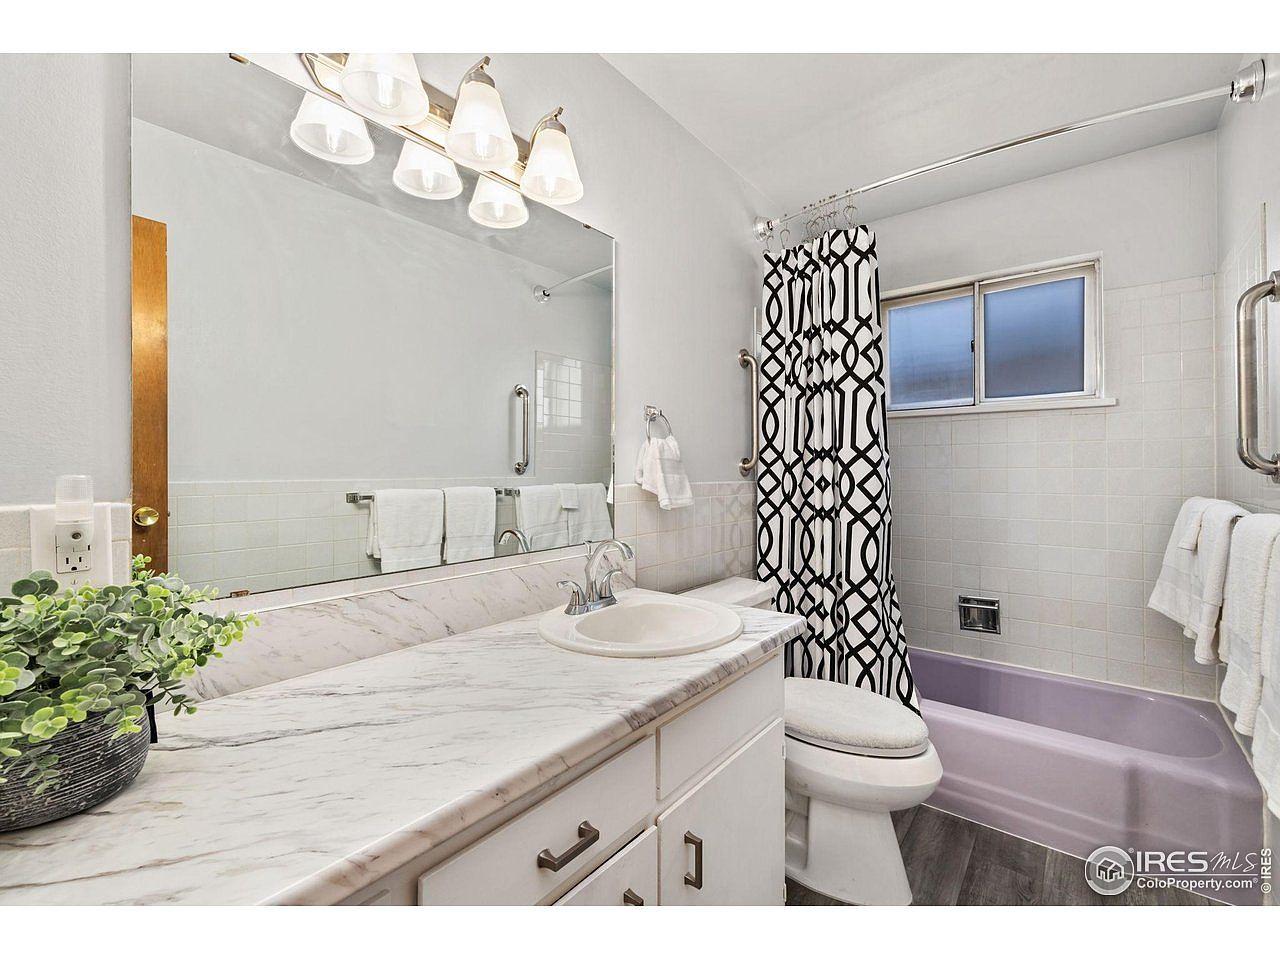
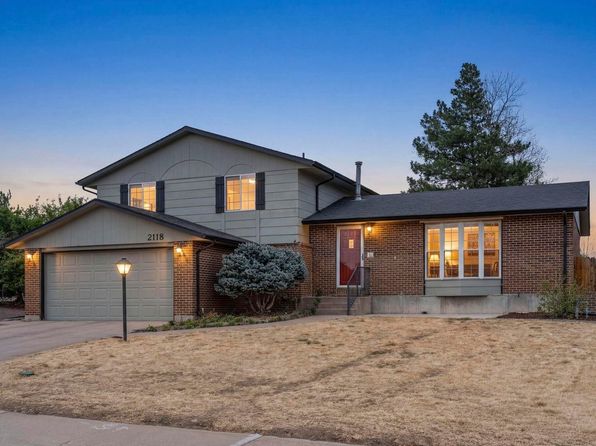
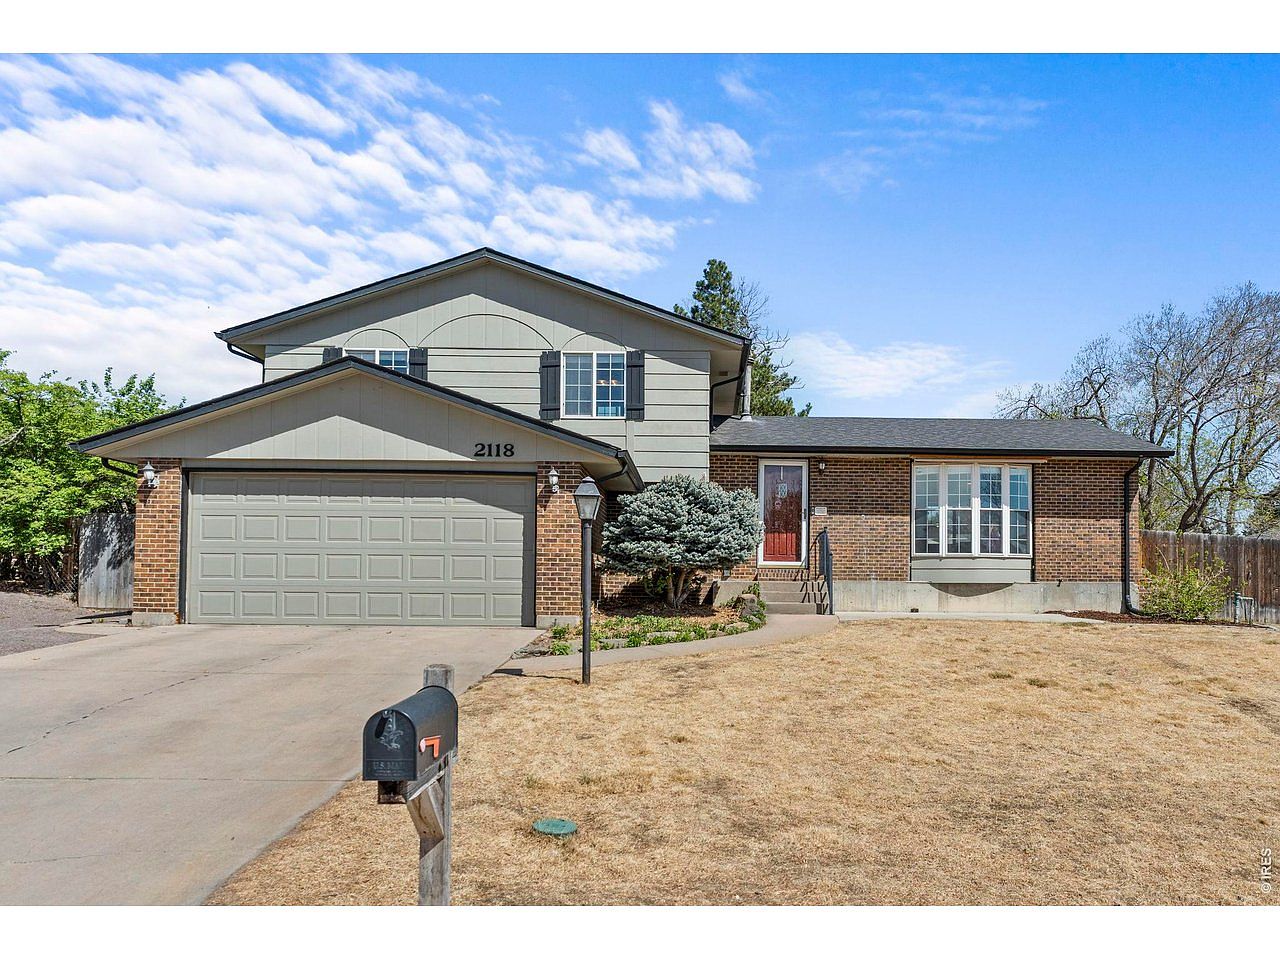
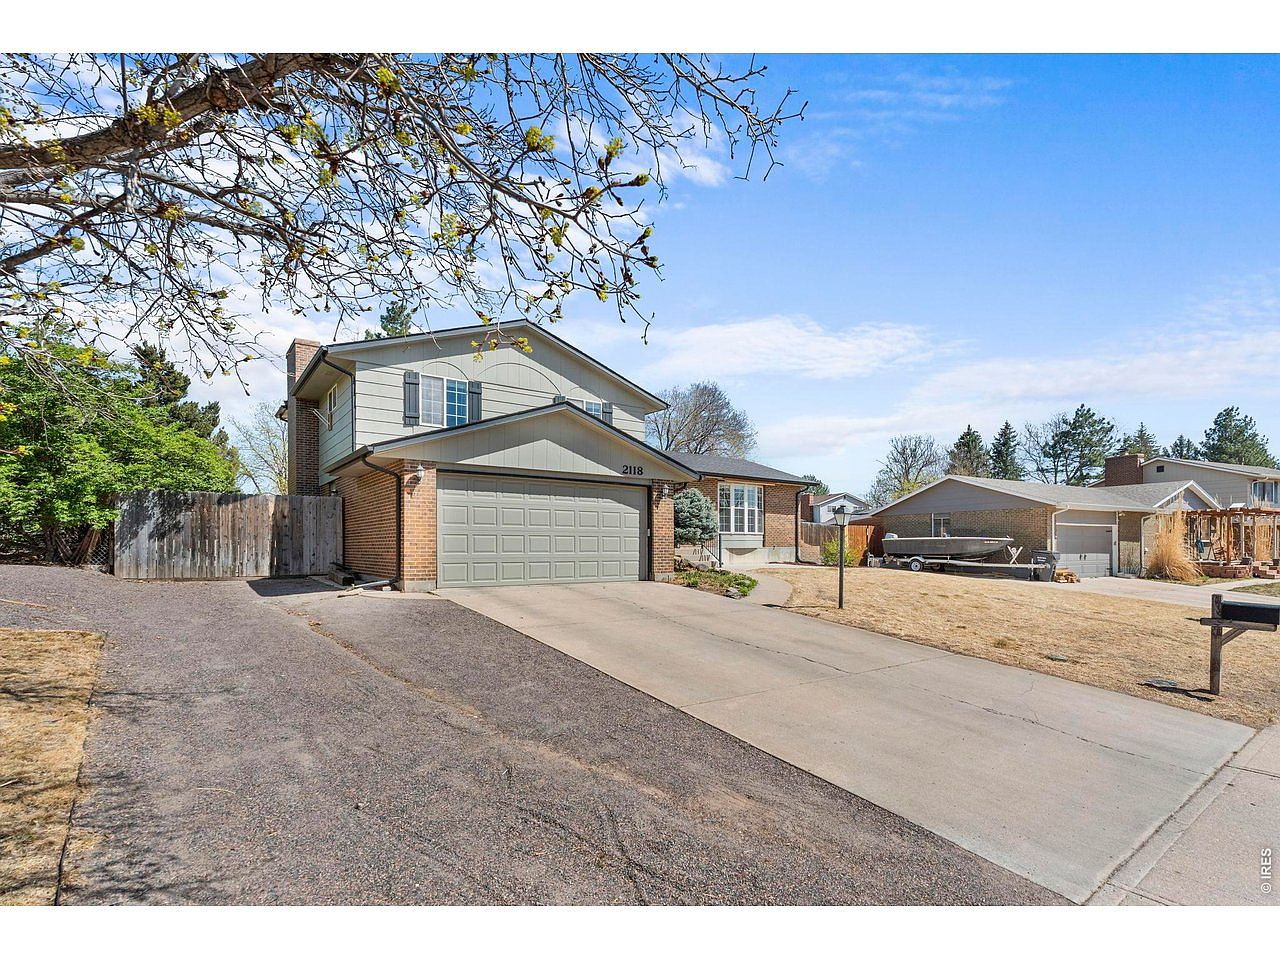
2118 27th Ave
#7 · 67% match · MLS 1056692
-65 sqft · 5/3 bed/bath · same era · same garage
Sq ft 2327
Bd / Ba 5 / 3
Year · Gar 1972 · 2
DOM · $/SF 51d · $198
1 / 7
$327,500
Sold 2026-06-17 · -288 sf
Sold lower
611 41st Ave
#8 · 66% match · MLS 1059984
-288 sqft · same bed/bath · +8 yrs · same garage
Sq ft 2104
Bd / Ba 4 / 2
Year · Gar 1977 · 2
DOM · $/SF 22d · $156
Market map
Your home Selected comps
Hover a pin for a quick peek. Click a sold home to add or remove it as a comp.
Address
Sold
Price
SqFt
Bd/Ba
Year
Gar
DOM
$/SF
507 31st Ave
2026-06-05
$400,000
2320
4/2
1969
2
29
$172
3711 W 7th St Rd
2026-07-06
$415,000
2218
4/2
1972
2
95
$187
502 46th Ave
2026-07-02
$415,000
2420
4/3
1978
2
35
$171
1809 24th Ave Pl
2026-04-02
$425,000
2310
4/2
1967
2
59
$184
1424 40th Ave
2026-04-20
$445,000
2472
4/2
1979
2
72
$180
821 36th Ave
2026-06-10
$420,000
2431
4/3
1964
1
150
$173
2118 27th Ave
2026-06-05
$460,000
2327
5/3
1972
2
51
$198
611 41st Ave
2026-06-17
$327,500
2104
4/2
1977
2
22
$156
3Closest Comparable Sales · continued
Remaining close sales in this set — same ranking as the live presentation.
1 / 14
$445,000
Sold 2026-04-20 · +80 sf
Sold higher
1424 40th Ave
#5 · 72% match · MLS 1051172
+80 sqft · same bed/bath · +10 yrs · same garage
Sq ft 2472
Bd / Ba 4 / 2
Year · Gar 1979 · 2
DOM · $/SF 72d · $180
1 / 13
$420,000
Sold 2026-06-10
Sold higher
821 36th Ave
#6 · 70% match · MLS 1049396
similar size · 4/3 bed/bath · same era · sold 15 wks ago
Sq ft 2431
Bd / Ba 4 / 3
Year · Gar 1964 · 1
DOM · $/SF 150d · $173
1 / 14
$460,000
Sold 2026-06-05 · -65 sf
Sold higher
2118 27th Ave
#7 · 67% match · MLS 1056692
-65 sqft · 5/3 bed/bath · same era · same garage
Sq ft 2327
Bd / Ba 5 / 3
Year · Gar 1972 · 2
DOM · $/SF 51d · $198
1 / 7
$327,500
Sold 2026-06-17 · -288 sf
Sold lower
611 41st Ave
#8 · 66% match · MLS 1059984
-288 sqft · same bed/bath · +8 yrs · same garage
Sq ft 2104
Bd / Ba 4 / 2
Year · Gar 1977 · 2
DOM · $/SF 22d · $156
4How Does Your Home Compare?
Look at the comps above. Condition, updates, and curb appeal change what buyers will pay. Lock a band — or fine-tune 1–10 — and we’ll apply it when we set the list.
05 typical10
Condition vs typical
—
Your rating
5/10
Starting at 5/10 (typical for this set). Adjust together — list dollars unlock in Price it.
Step 5 · Where you sit
5Your Home on the Price vs Sq Ft Map
Orange line = sold trend · Tap layers on/off ·Recent sales
At the recommended list, you would be priced in the top 57% of recent similar sales (above about 43% of those closes).
Step 6 · Market detail
6Pace — Is the Market Speeding Up or Slowing?
Year-over-year sales tell you whether demand is building or thinning in this exact segment.
2025
144 sales · $400k med · 48d DOM
2026
76 sales · $397k med · 43d DOM
Sales volume
Talking point
2026 sales are -47% vs 2025 (76 vs 144). A thinner market means pricing accuracy matters more. Same months YTD: 76 sales this year vs 144 last year (-47%).
Sales by year
Same-month · last year vs this year
Step 6b · What buyers paid
Prices — What the Market Is Actually Paying
Median sold price is the clearest signal of buyer willingness to pay in this set.
Price movement
Talking point
Median sold price is holding near $397k year over year. Stability is your friend — price into the heart of recent closes.
Median sold price by year
Median sold price by month
Step 6c · How long it takes
Timing — Days on Market
Median: 46 days — price with the market and this is the pace to expect.
Time to contract
Talking point
Homes are moving faster — median DOM is 43 days (-9% vs 2025). Well-priced listings get attention quickly.
Median DOM by year
Where sales land
Sales volume trend
Advantages
Larger than typical living area for this market segment.
Two-car (or larger) garage is expected by most buyers in this price range.
Watch-Outs
Main risk is overpricing relative to the current absorption rate.
7Price It — Strategy & Trade-Offs
Set the list with the slider — strategy cards snap you to a lane. Then see market positioning vs. what happens while you wait.
Recommended List Price
$410,000
Zillow estimate
Range $396,000 – $426,000 · target under contract in ~46 days
Top 57% of similar recent sales
AggressiveHeart of marketOverpriced
Bottom Line — This is a strong seller's market with 2.2 months of inventory. Based on 257 recent sales, your home is best positioned between $396,000 and $426,000, with a recommended list price of $410,000. At that level we would expect roughly 46 days to contract. Launch inside the competitive range — that creates the strongest outcome.
Rec
—Recommended—
Pick a price above to see the market response.
While You WaitCheaper competition while you sit
Buyers shop value first. Raise the list — more homes sit under you, and more keep listing under you while you wait.
4
Already cheaper?
~3.5/mo
New under you?
~9
In your wait?
At 410,000~46 days to contract
At the recommended list, the queue works for you. Price above it and buyer attention shifts to cheaper options.
Market Fingerprint
The living market picture after they list — still active, new, pending, sold.
Estimated proceeds at the price on the slider — move it and this sheet updates. Tap any line to adjust to your situation. Estimates only, not a closing statement.
Selling costs
Seller broker fee
%
—
Buyer broker fee
%
—
Seller concession credits offered to the buyer
$
—
Misc. — inspection repairs standard allowance
$
—
Total selling costs
—
Closing expenses· seller-paid
Prop. taxes auto · annual rate prorated to close
%
—
Closing date drives the tax proration
—
Owner's title policy auto · ≈0.15% of price
$
—
Owner's extended coverage
$
—
Bundled closing fees
$
—
Final water final utility reading
$
—
Total closing expenses
—
Mortgage payoff
Seller loan balance current mortgage payoff — not a selling cost
$
—
Total deductions selling + closing + payoff
—
Estimated net to seller
—
at — · — of list
—
—
Estimates only — your closer issues the official figures. Loan balance, concessions, and fees change this the most.
Full Market Data
Every home in this market · Active = competition · Pending/Backup = under contract · Dark In comps buttons are selected — click to remove · Sort by Comp to pull used rows to the top
Tip: paste one or more MLS numbers separated by commas or spaces.
Report sections
All sections are included by default. Uncheck any you want to hide on this presentation (and in print).
Add listing photo
From Matrix: open the listing → right-click the main photo → Copy image address. Or upload a photo you saved from MLS.
 Pricing Story