Adam Schwartz · Schwartz and Associates, Coldwell Banker Realty (970) 533-3990 · adam@saahomes.com Prepared August 10, 2026 MLS data through Jul 13, 2026
Built from the homes buyers would compare with yours: similar size, beds, baths, garage, lot, and location.
2
Supply and Demand
How many homes are for sale compared with how fast they sell. That balance decides whether buyers or sellers have more leverage.
3
Your Competition
Homes for sale right now that a buyer can tour. Homes already under contract (pending or backup) are not competition.
4
Three Levers: Price, Condition, Location
That’s what buyers compare. You can’t move the house. You can still choose the asking price and improve the condition.
5
Be the Better Value
When a similar home is priced below yours, it looks like the better buy and gets toured first. When similar homes are priced above yours, yours is the better buy.
6
Pricing Determines Time to Contract
Price is the biggest factor in how long a home takes to go under contract. Homes priced in line with recent sales sell in a normal time. Overpriced homes sit longer and make the homes around them look like better deals.
1Homes on the MarketStrong seller's market · 2.2 months of supply
24 similar homes are for sale today and about 11 sell each month. That is 2.2 months of supply, a strong seller's market.
Your competitive market
West Greeley · similar homes
Greeley2 ZIP codesJul 2024 – Jul 2026946–2,798 sq ft2–6 beds1–6-car garages, most 2
Agent criteria: Public sample listing — start a free trial to run your own MLS export.
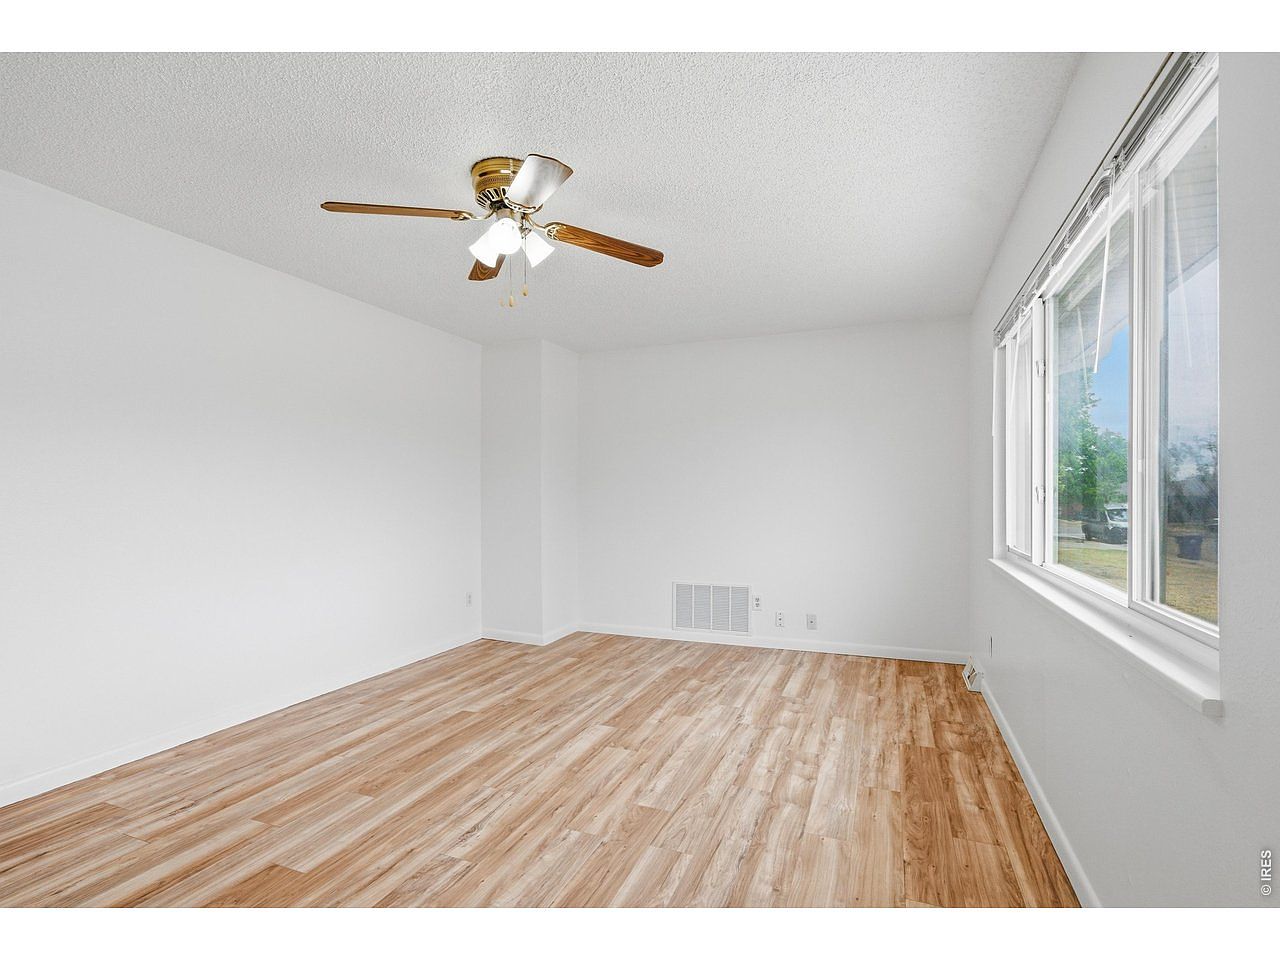
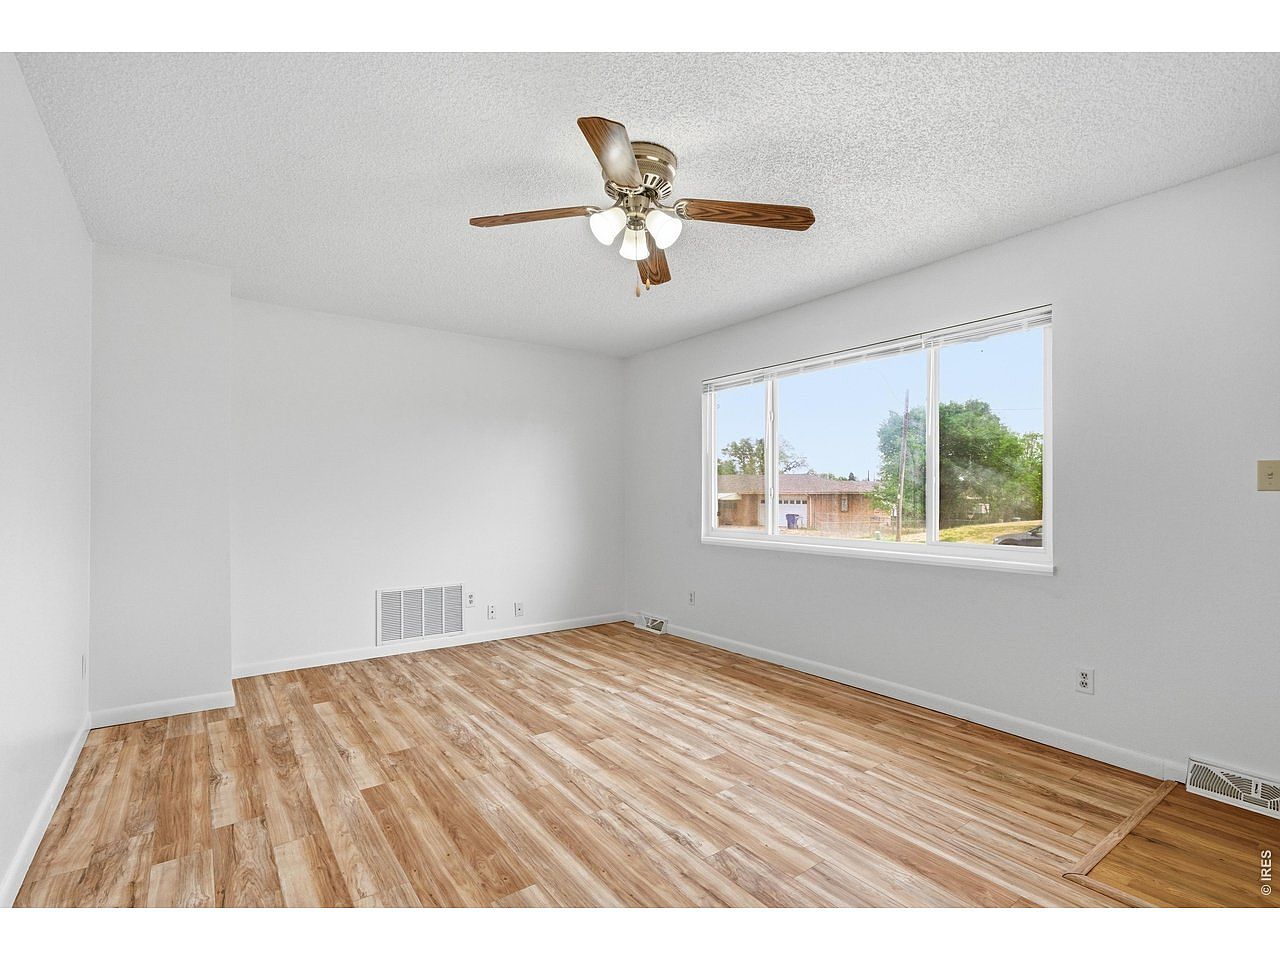
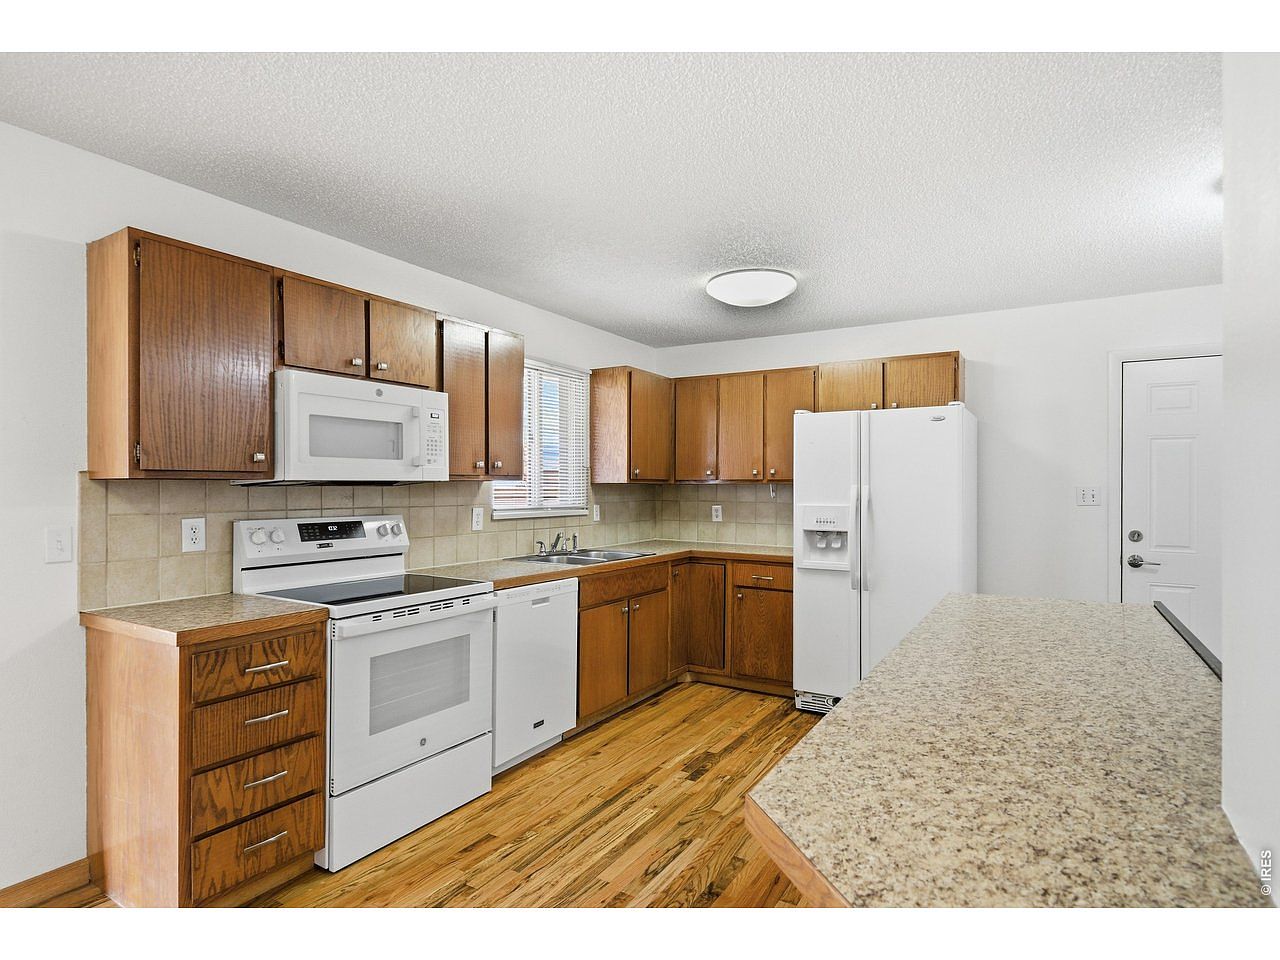
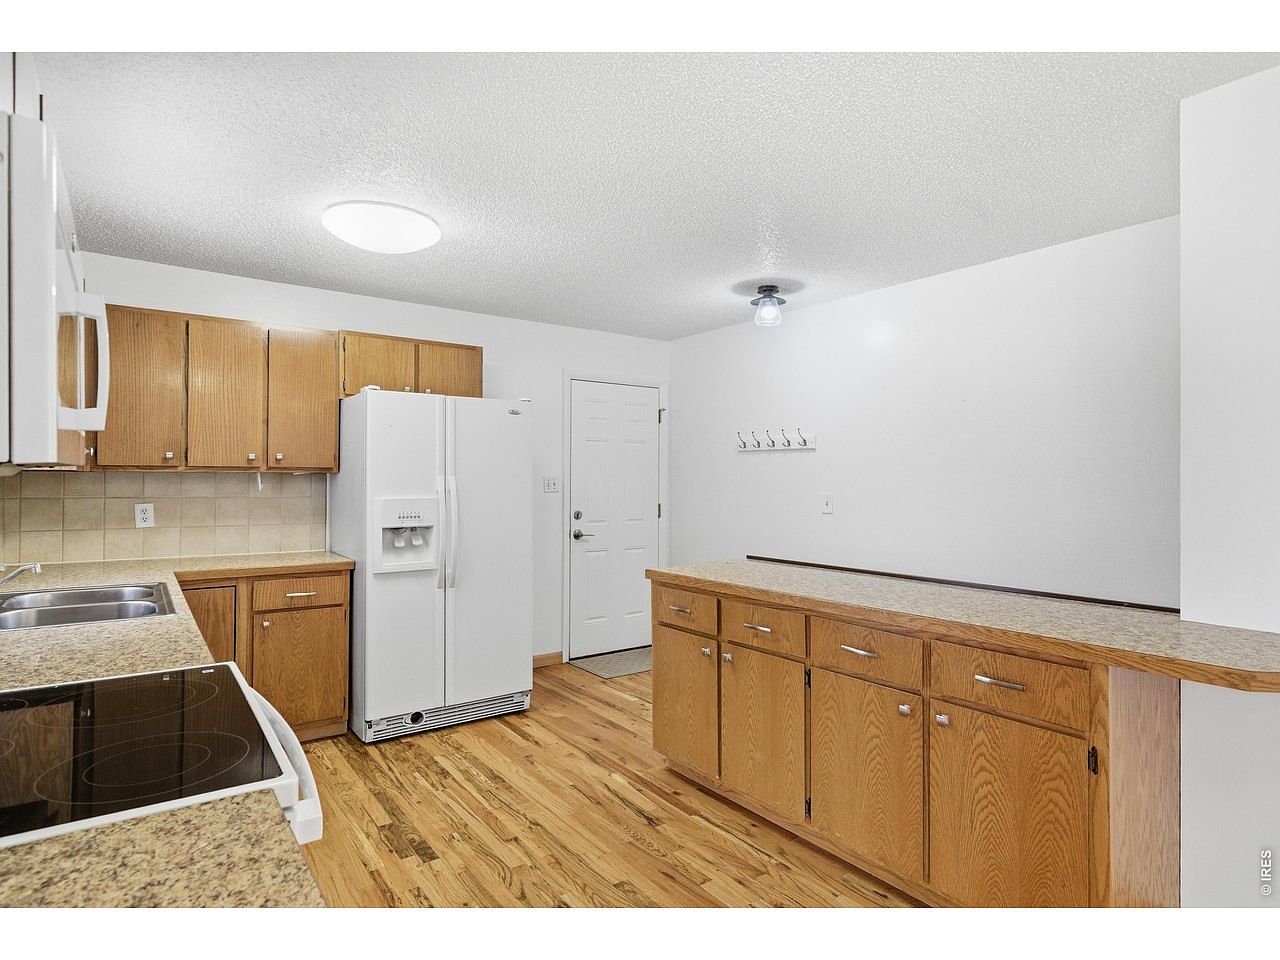
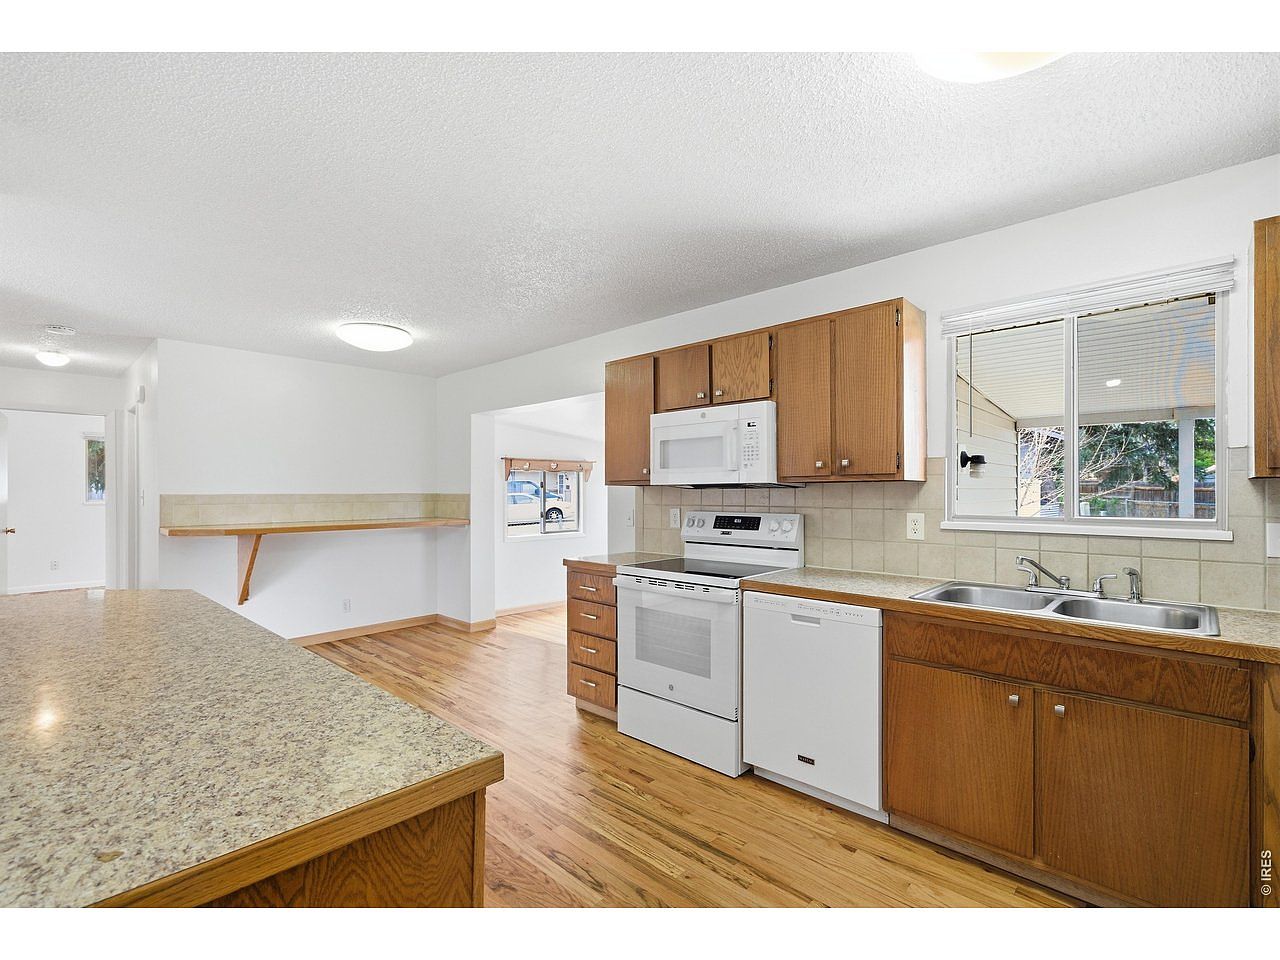
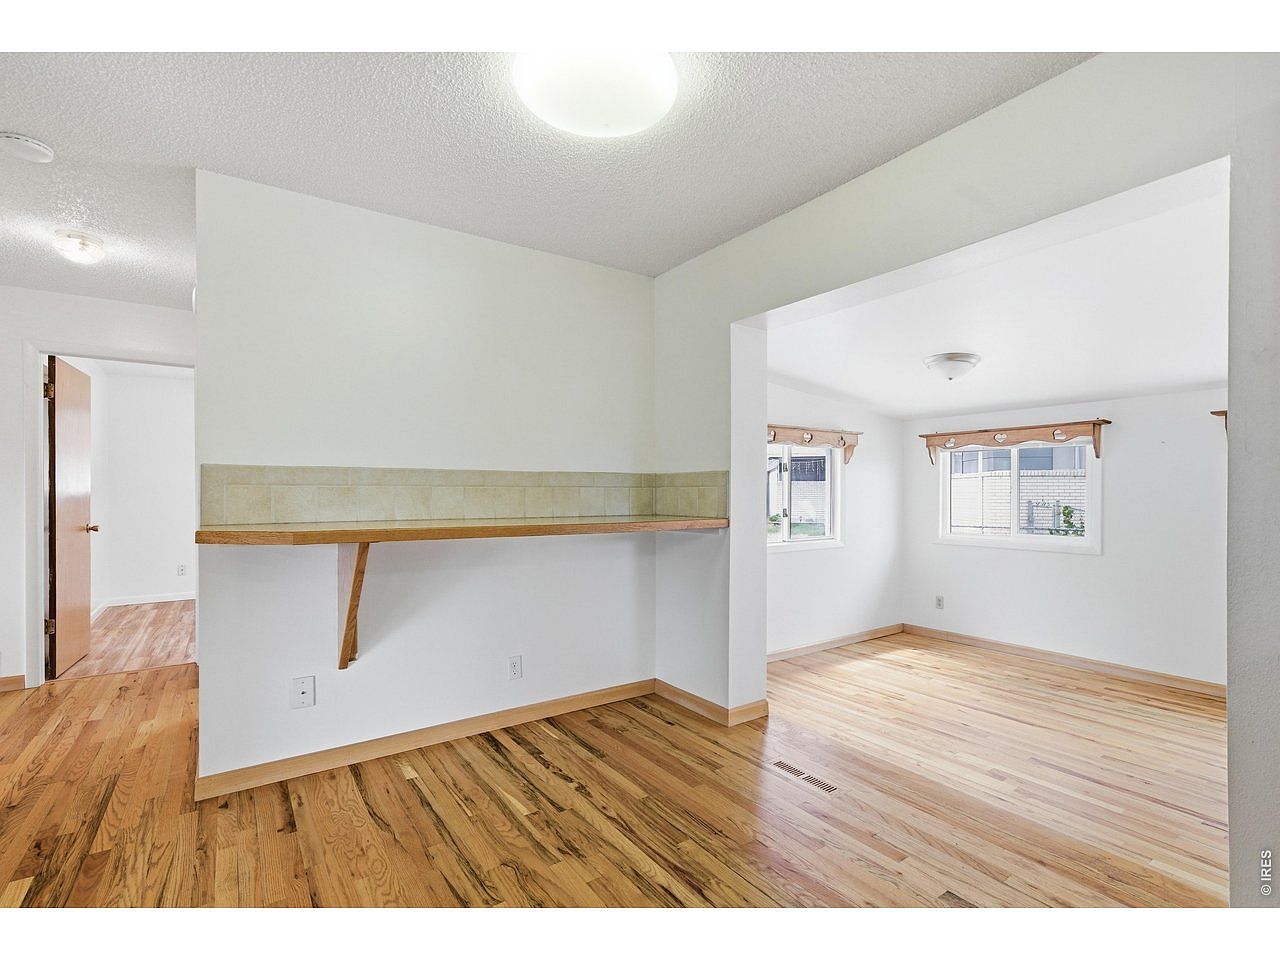
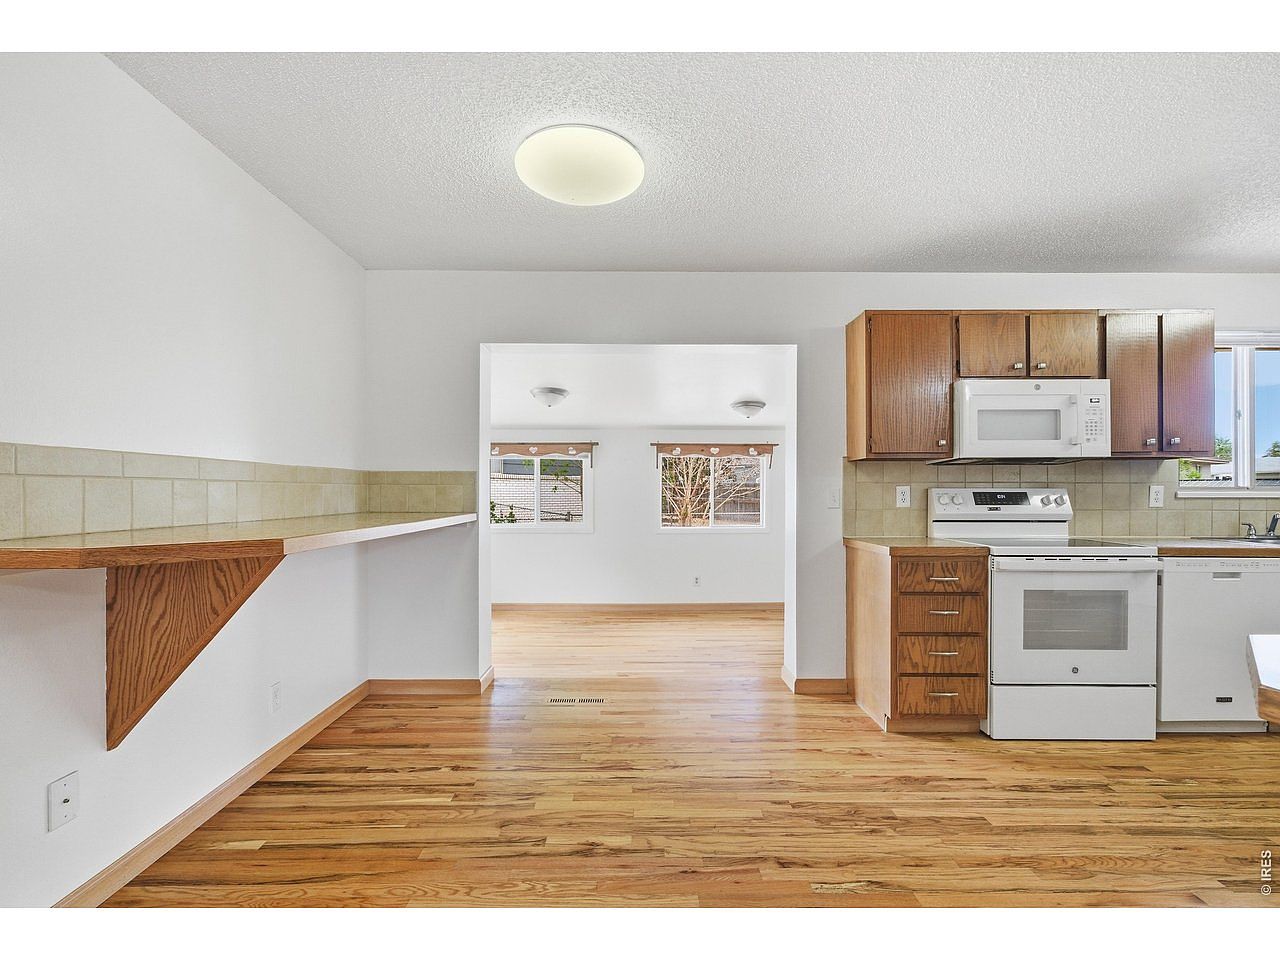
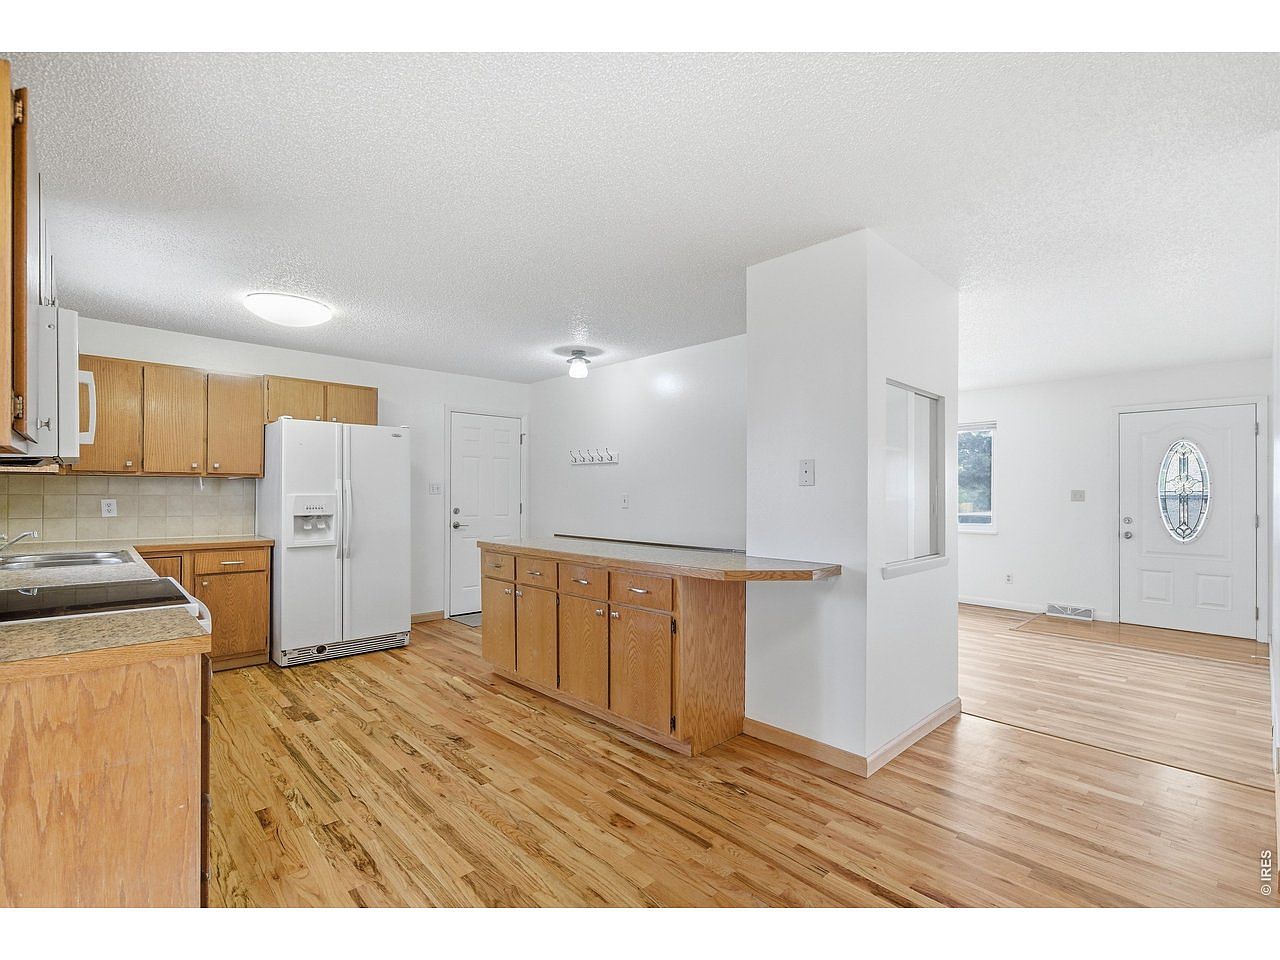
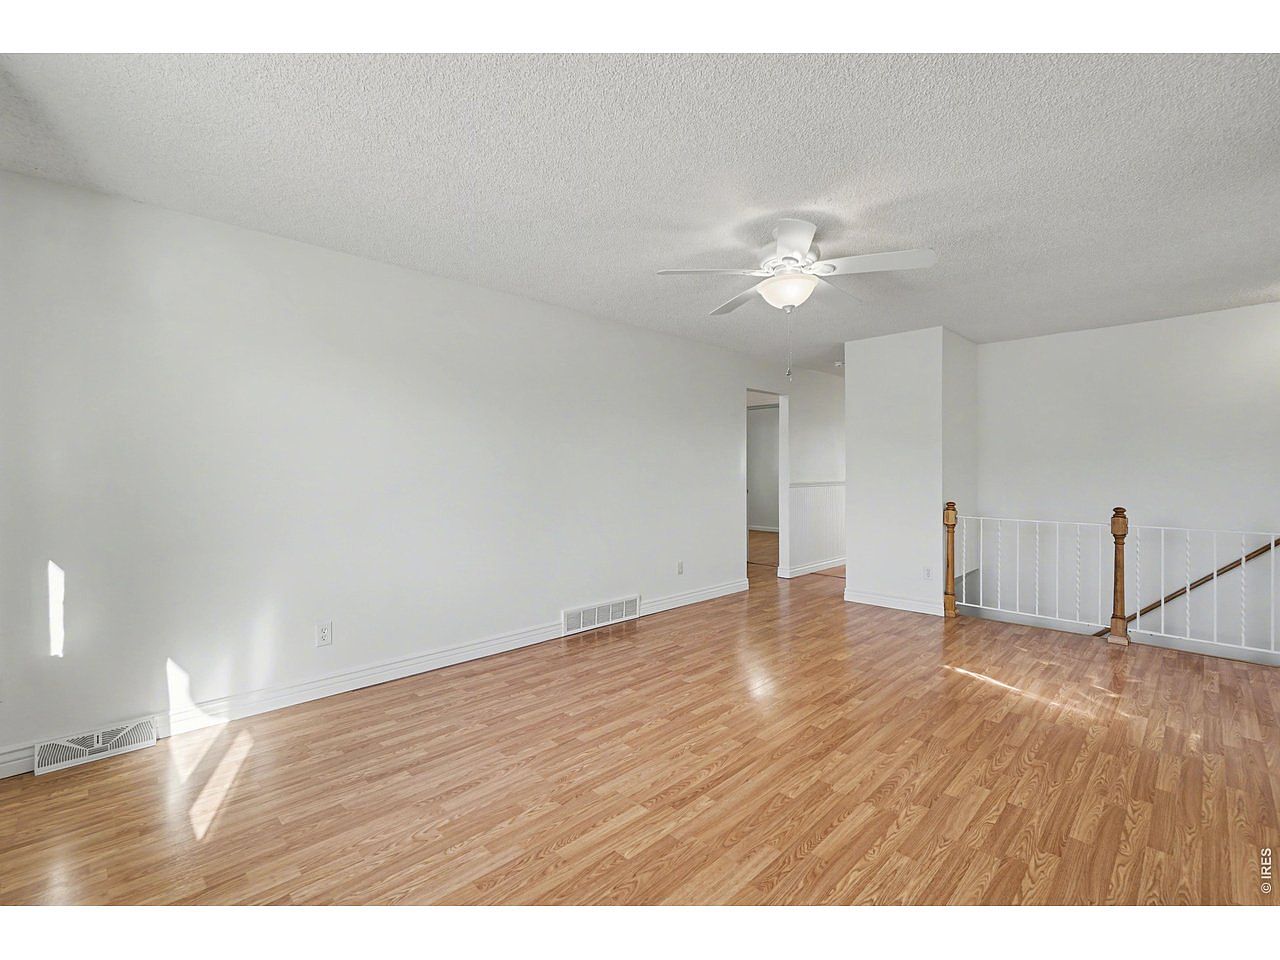
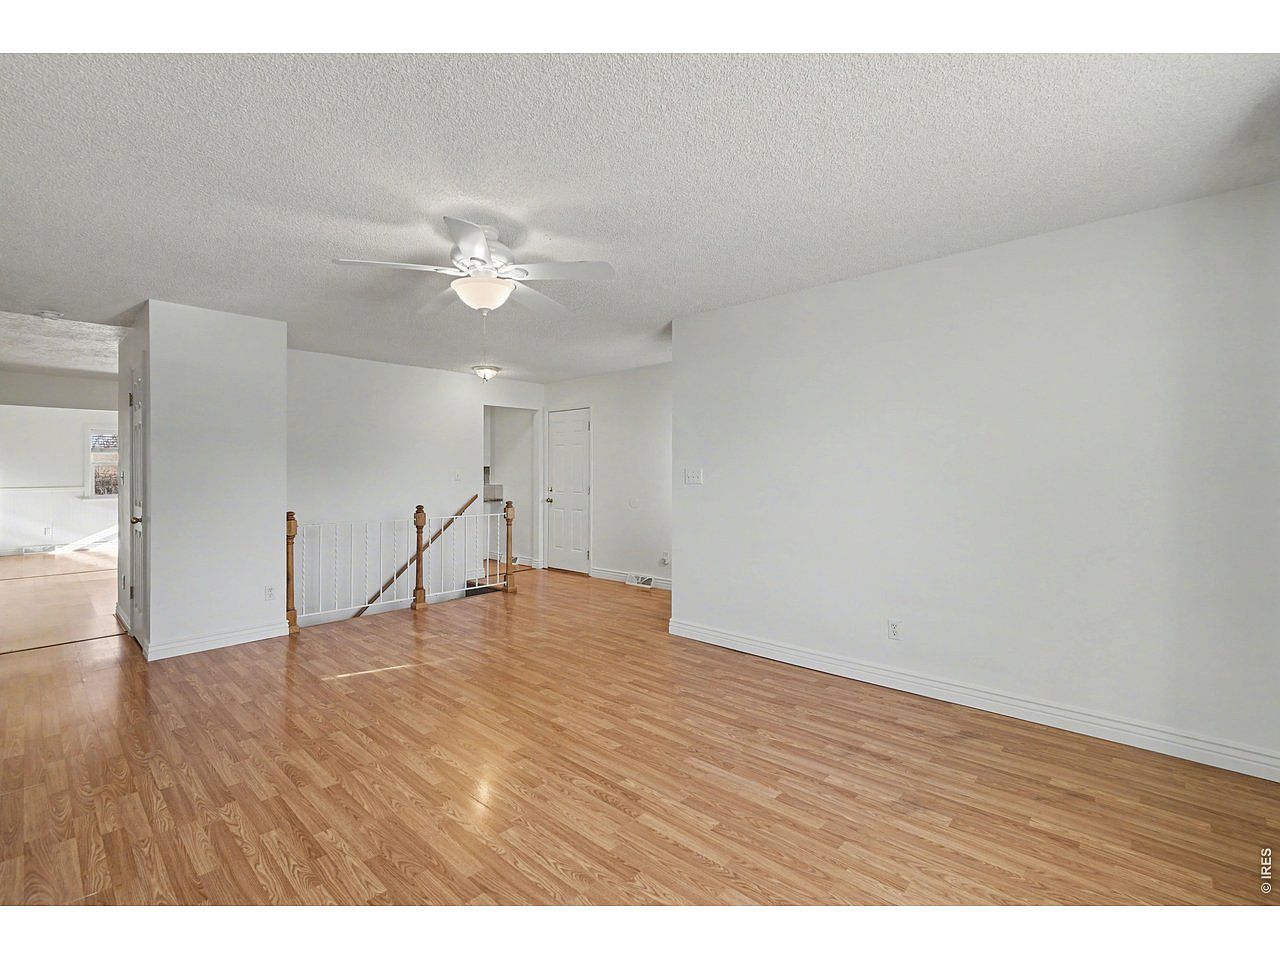
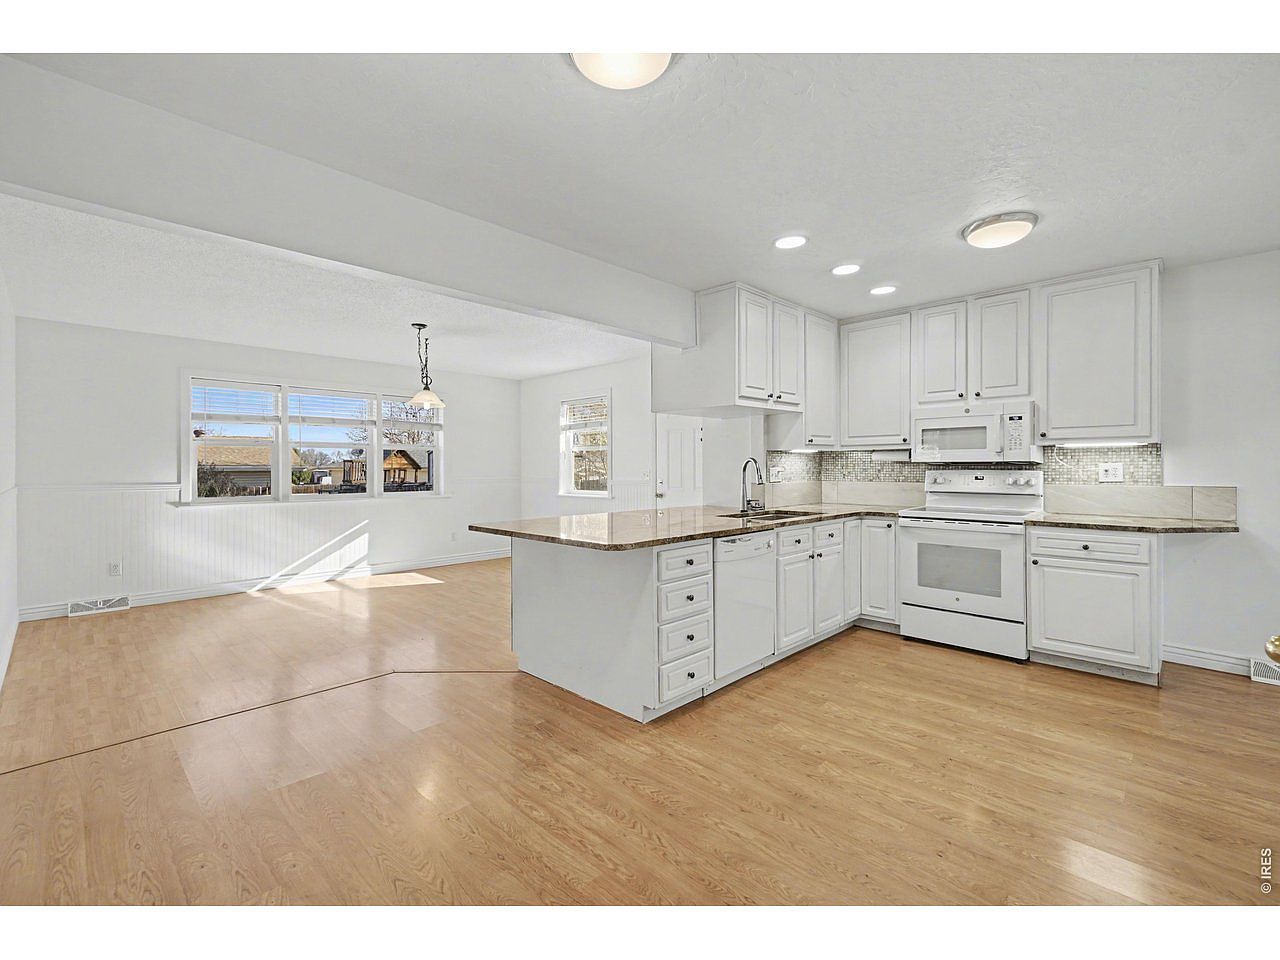
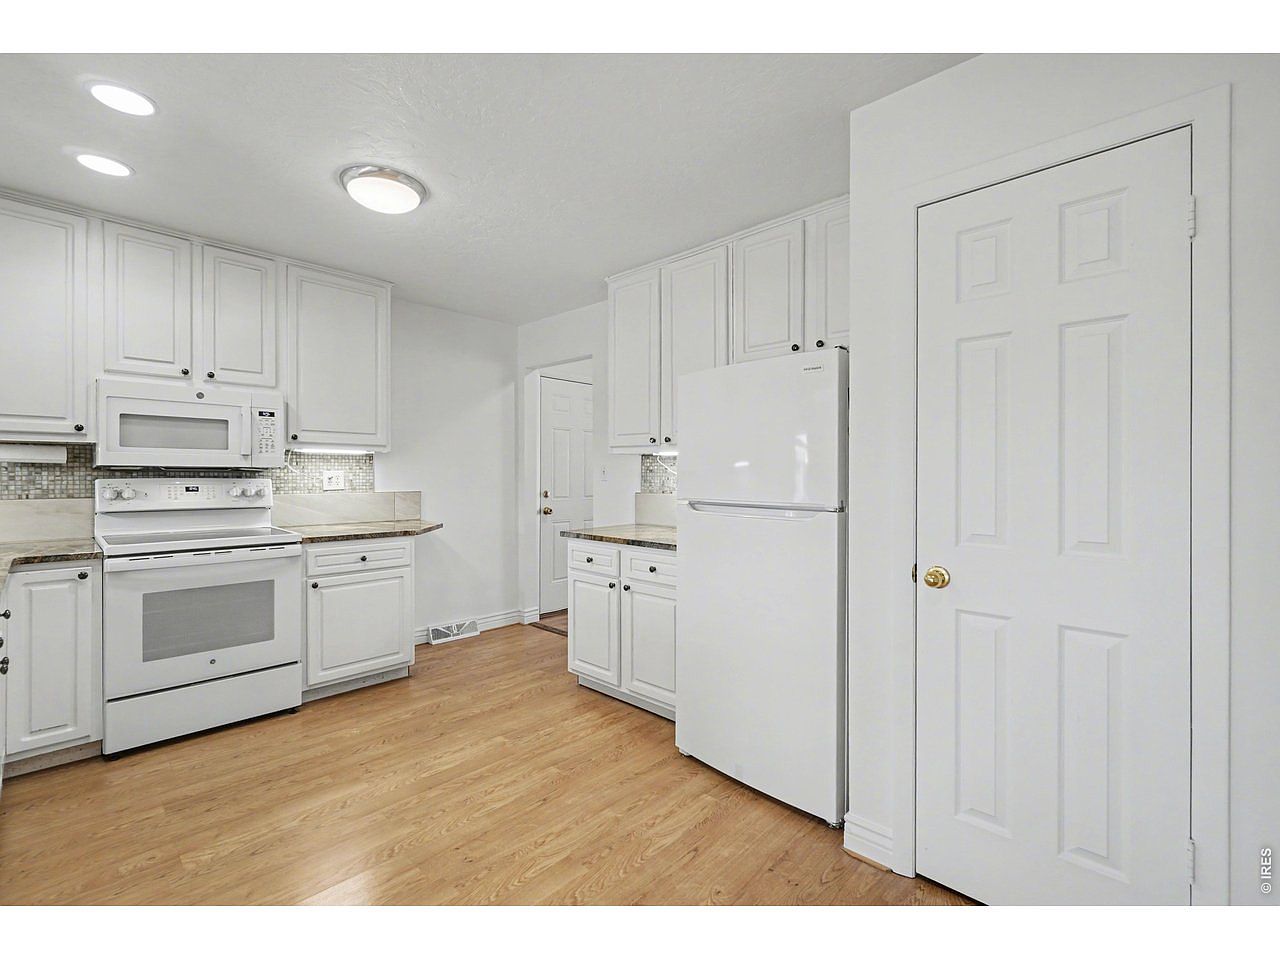
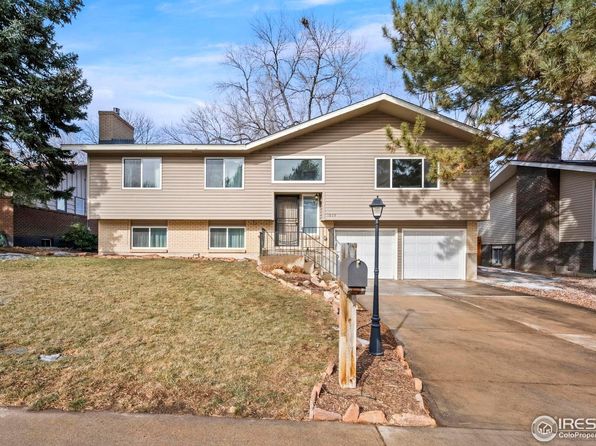
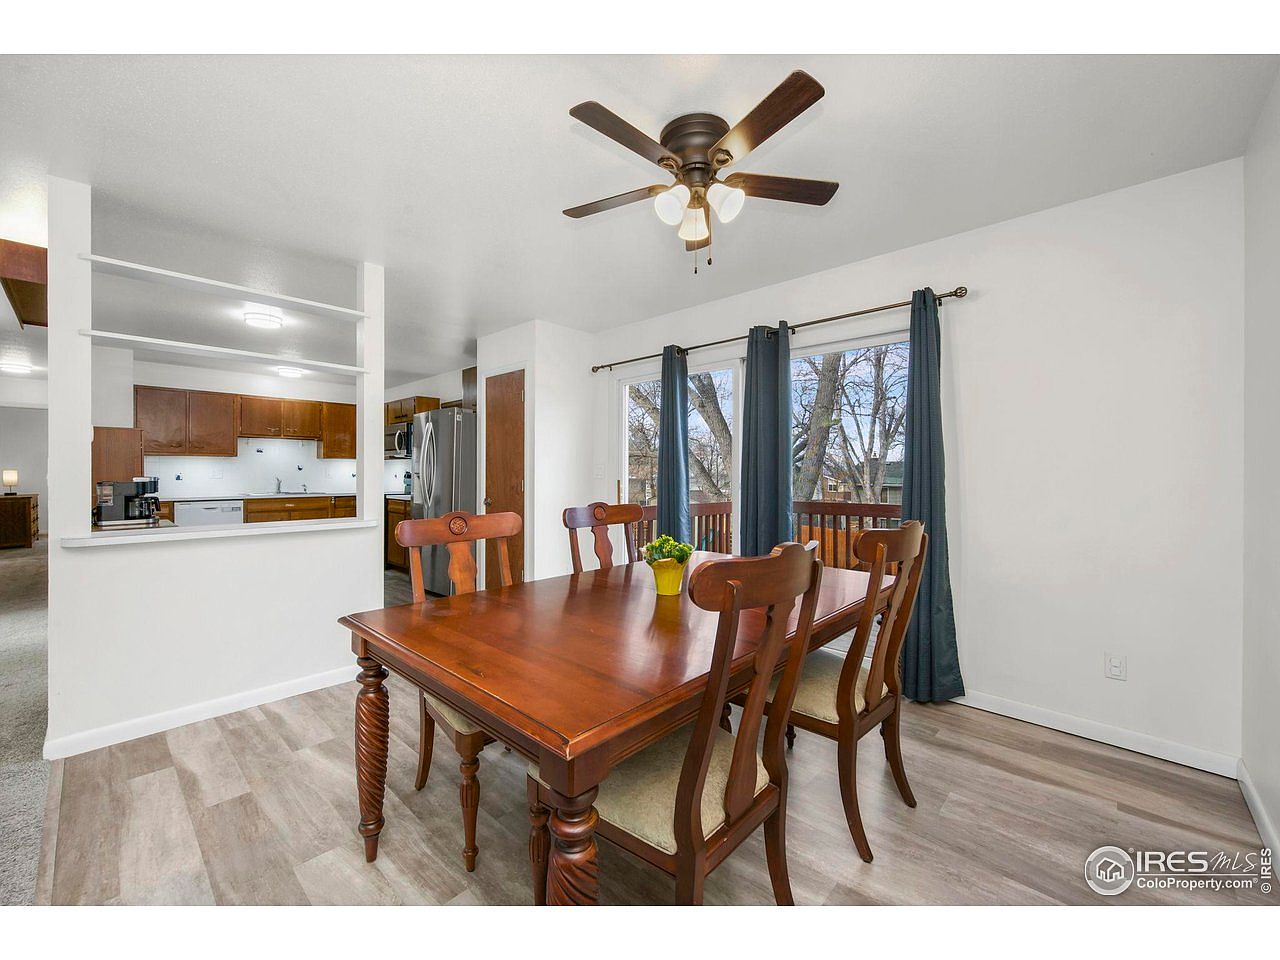
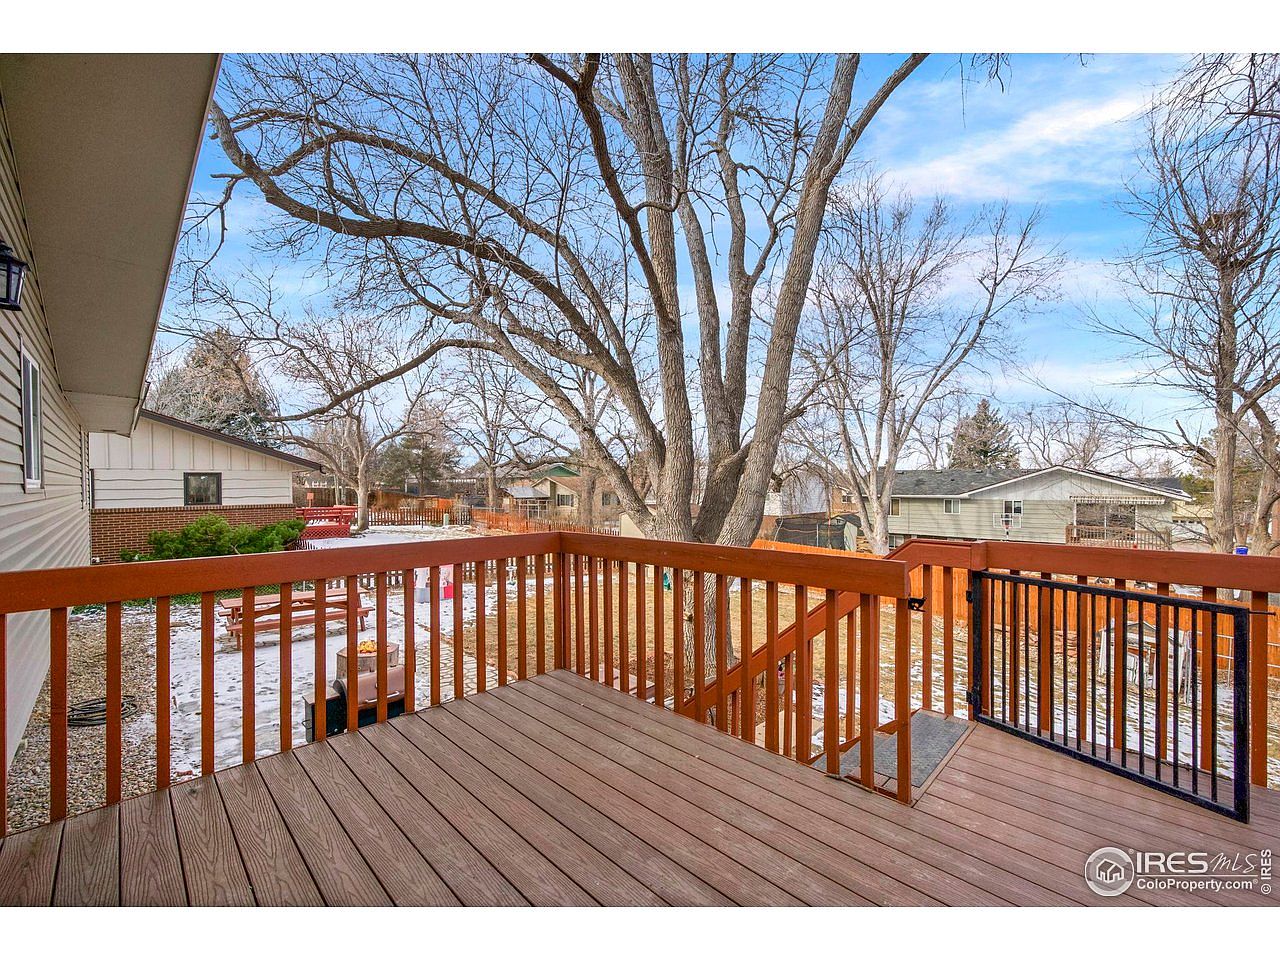
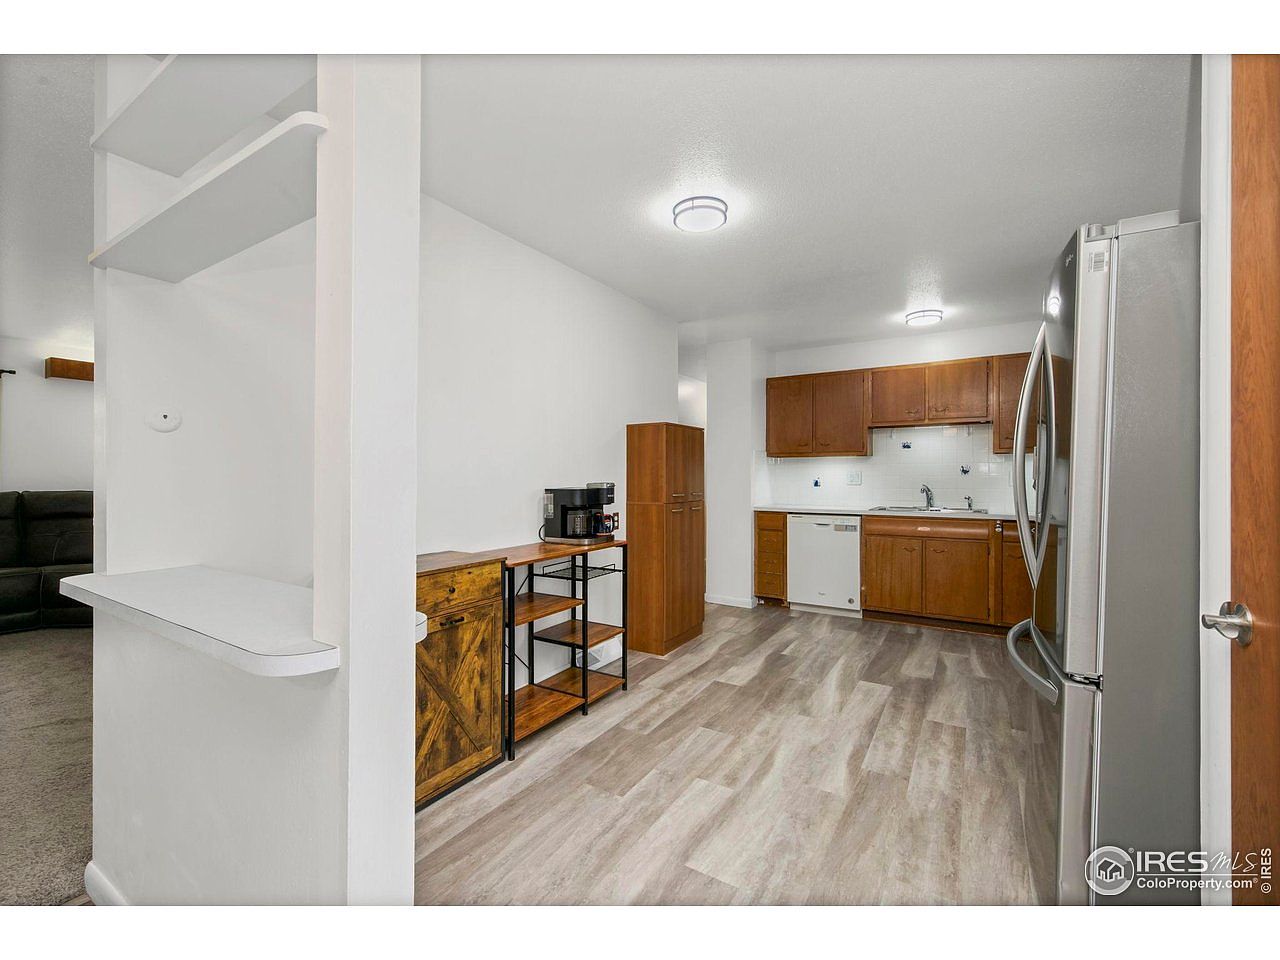
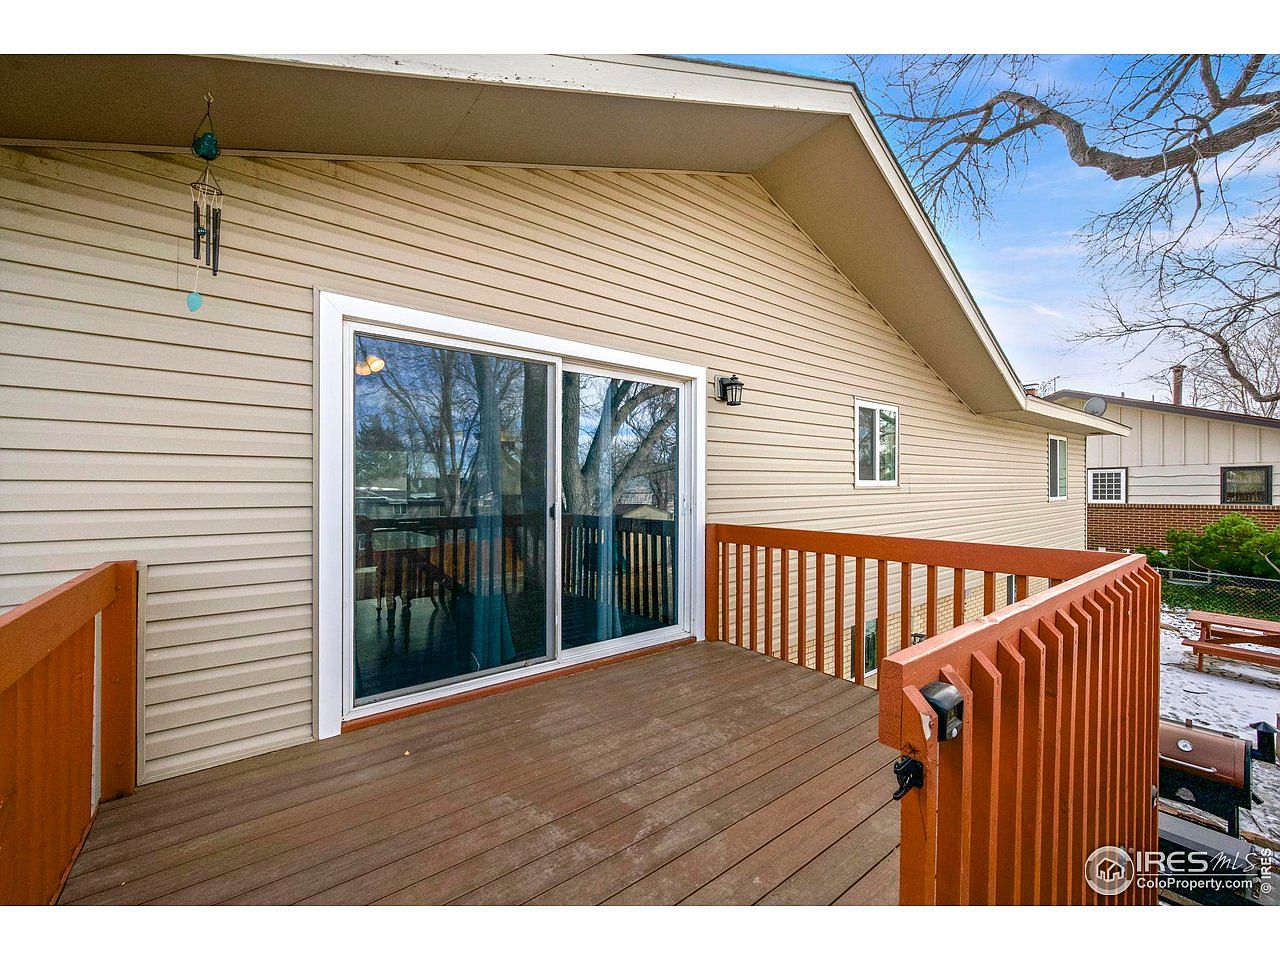
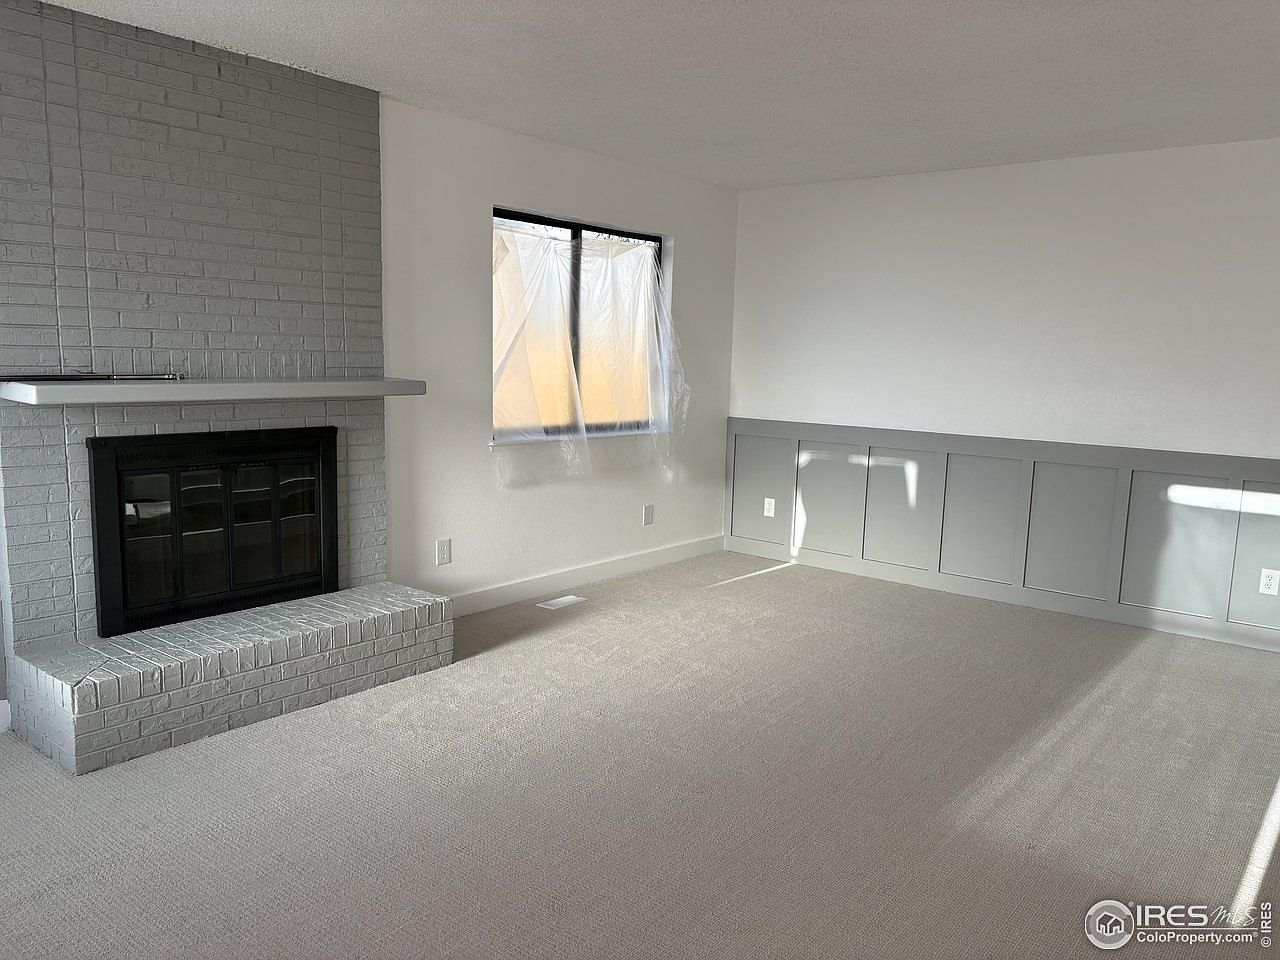
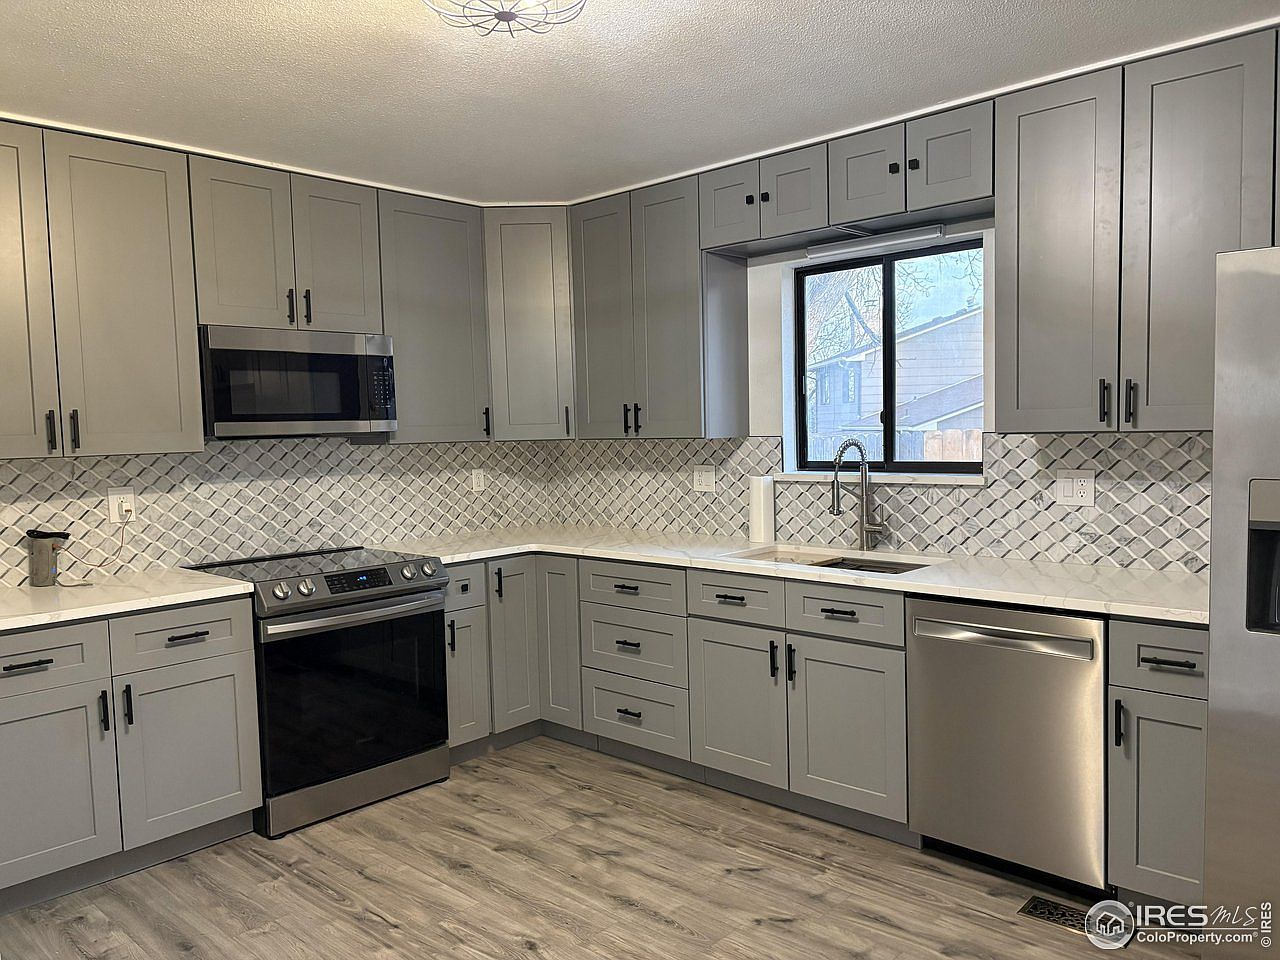
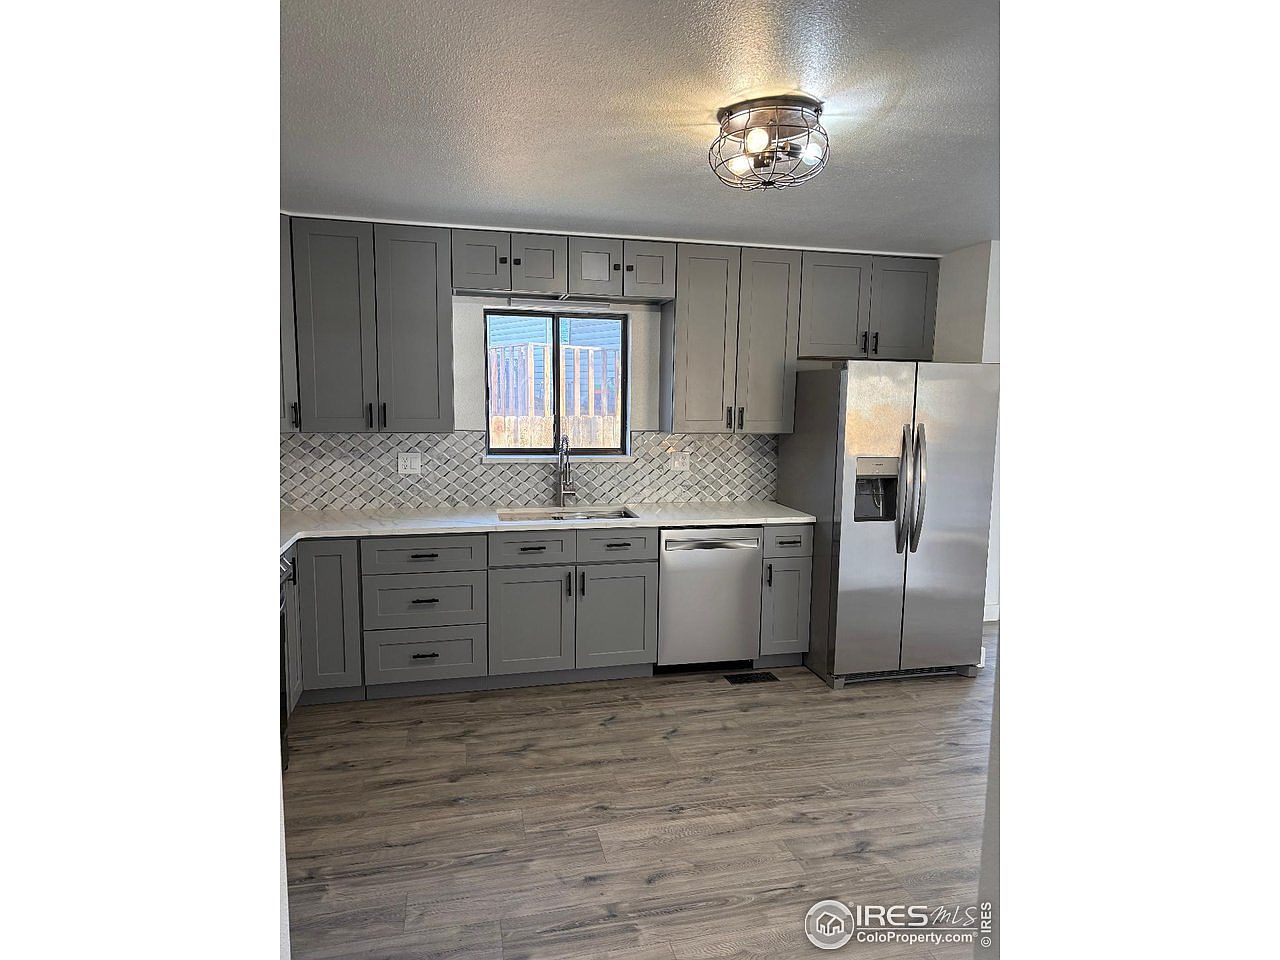
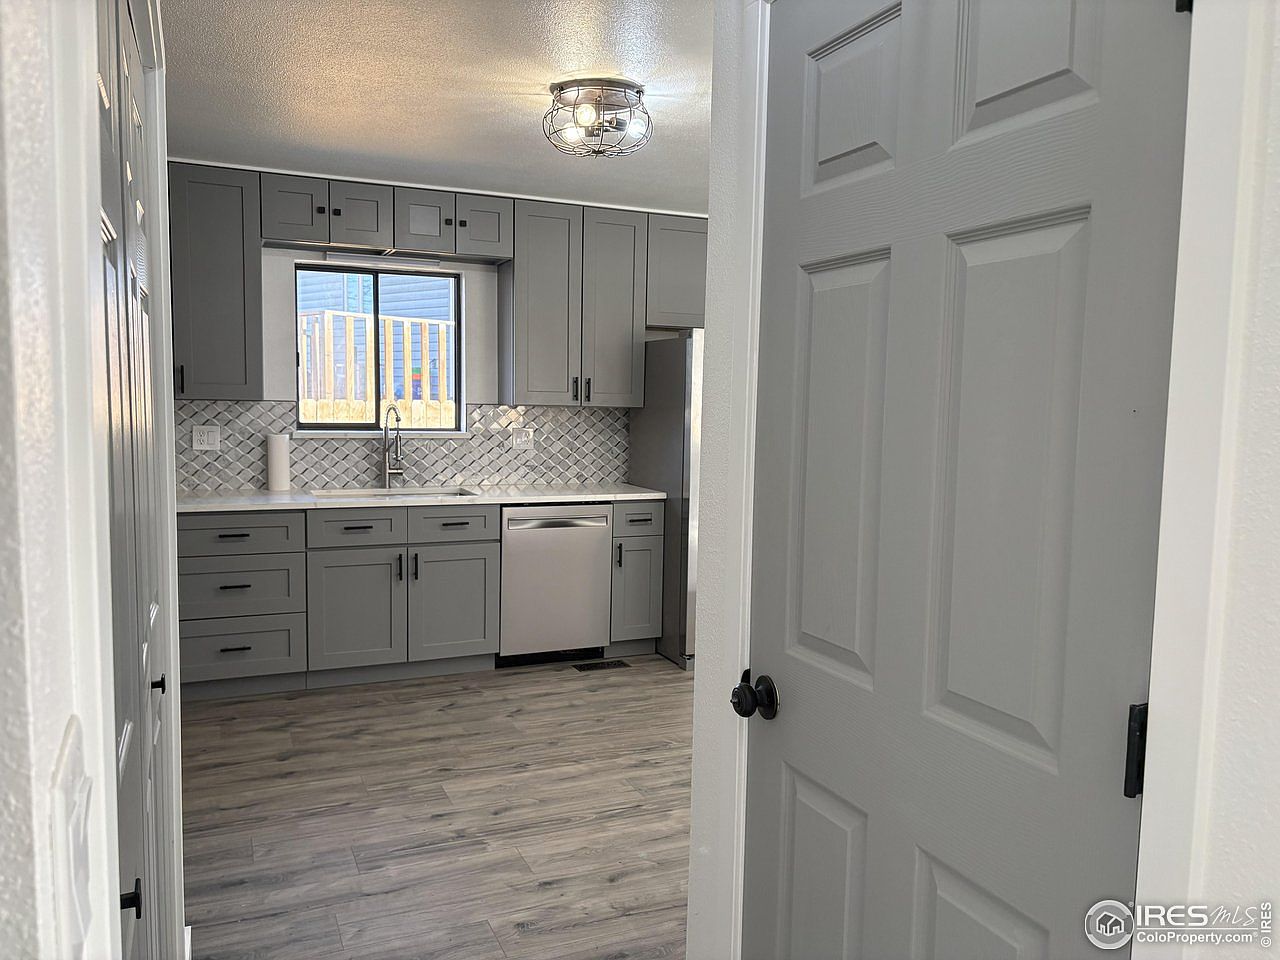
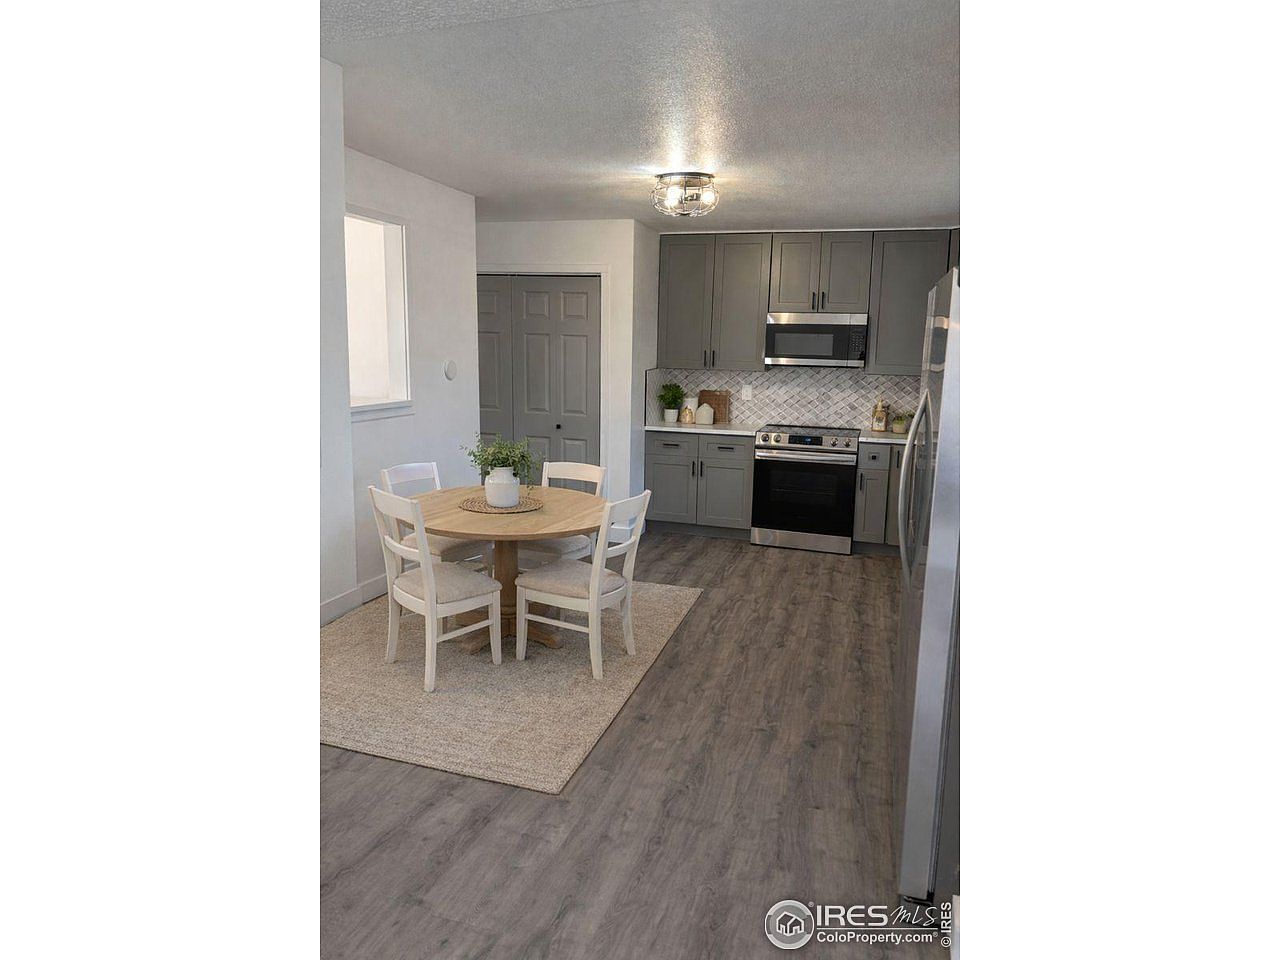
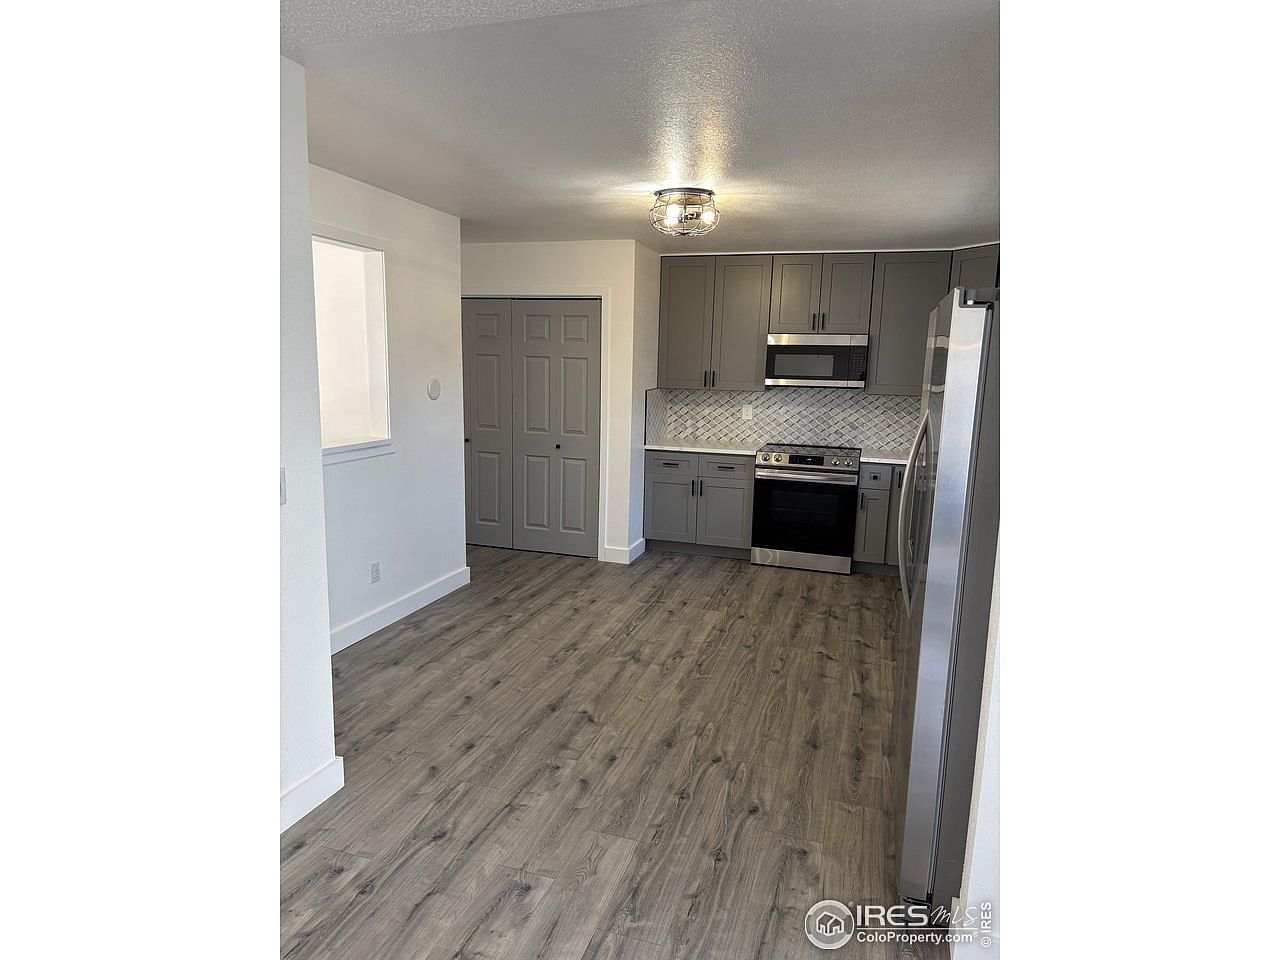
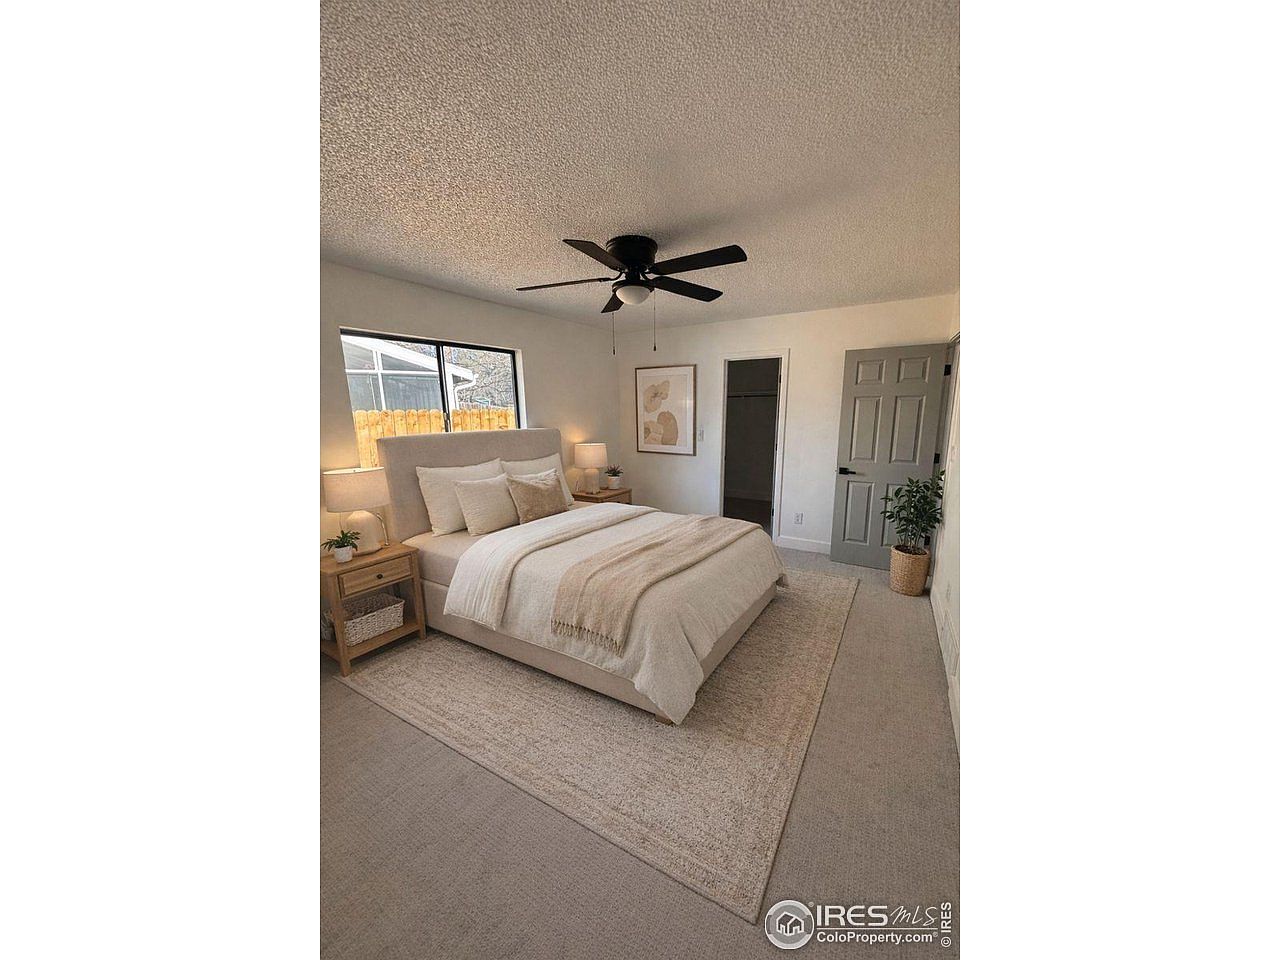
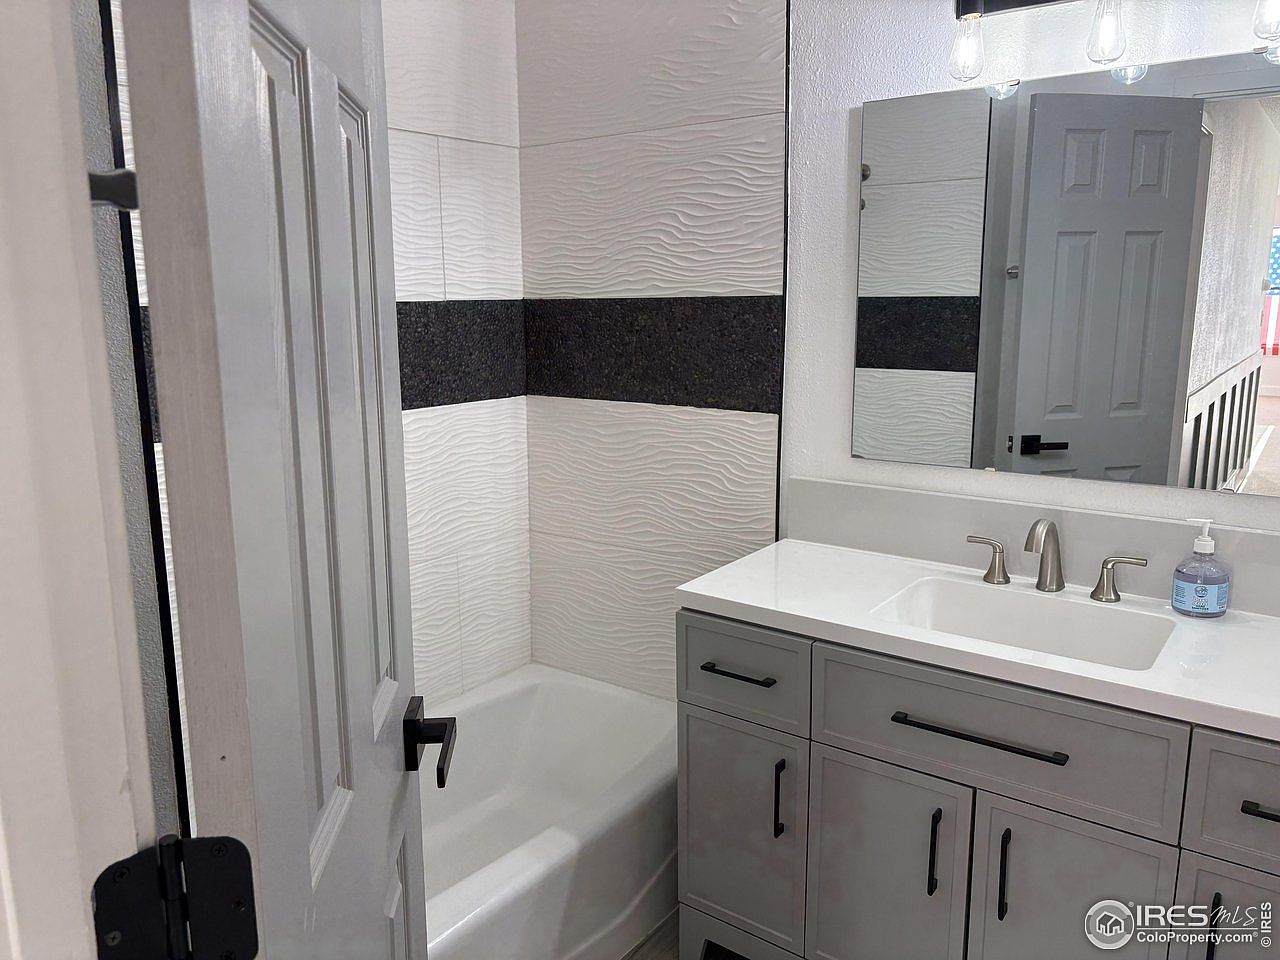
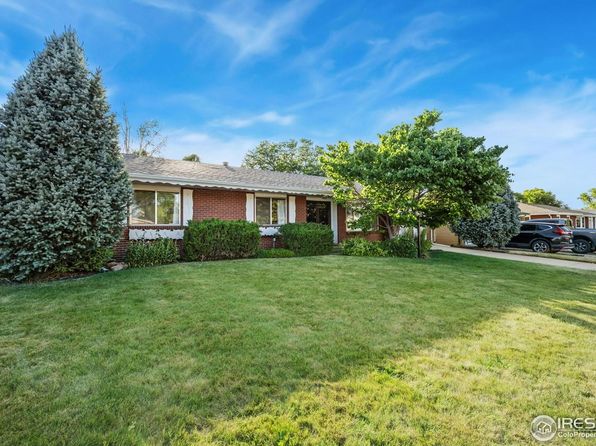
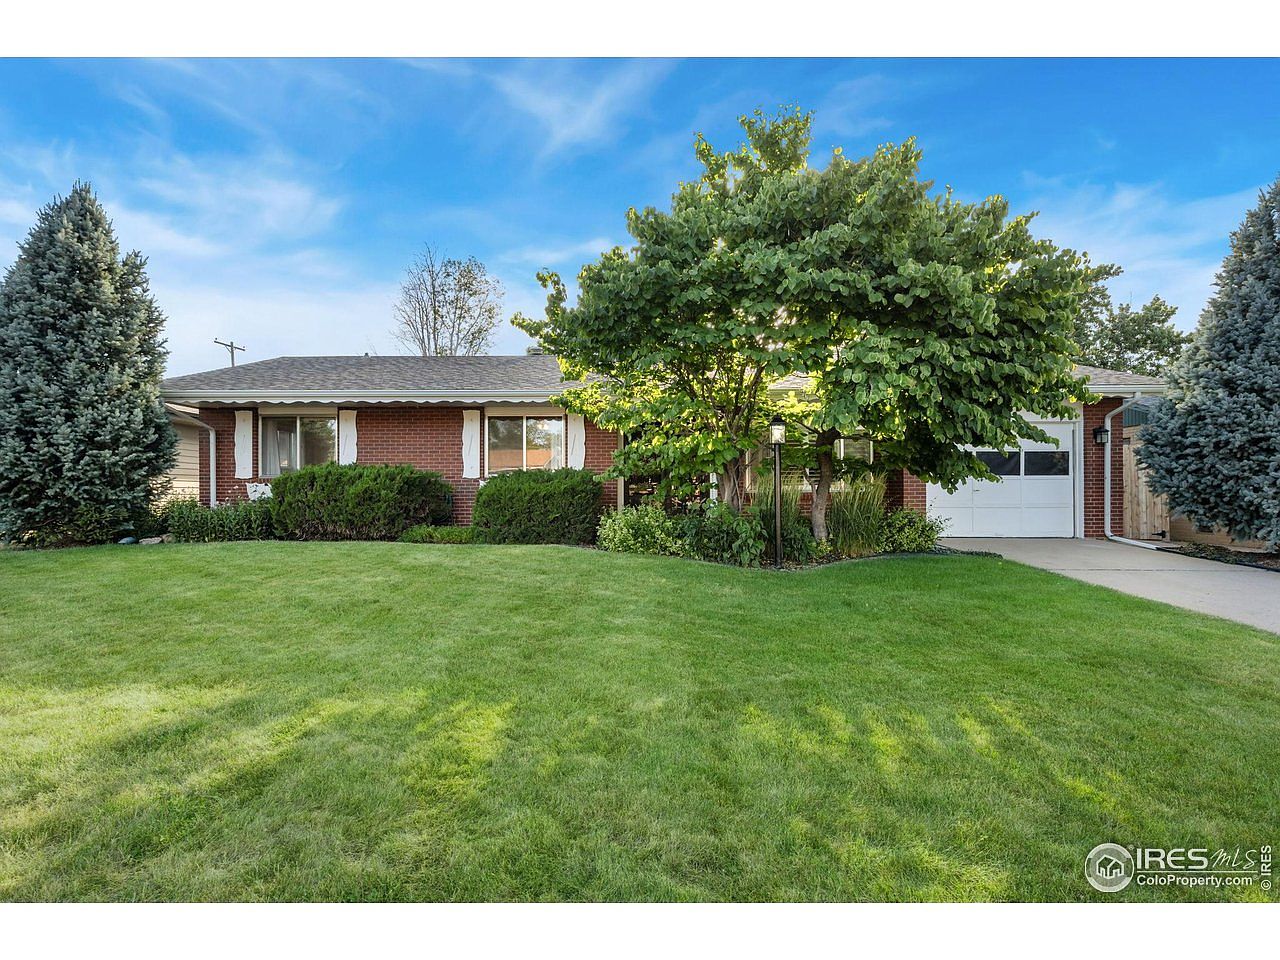
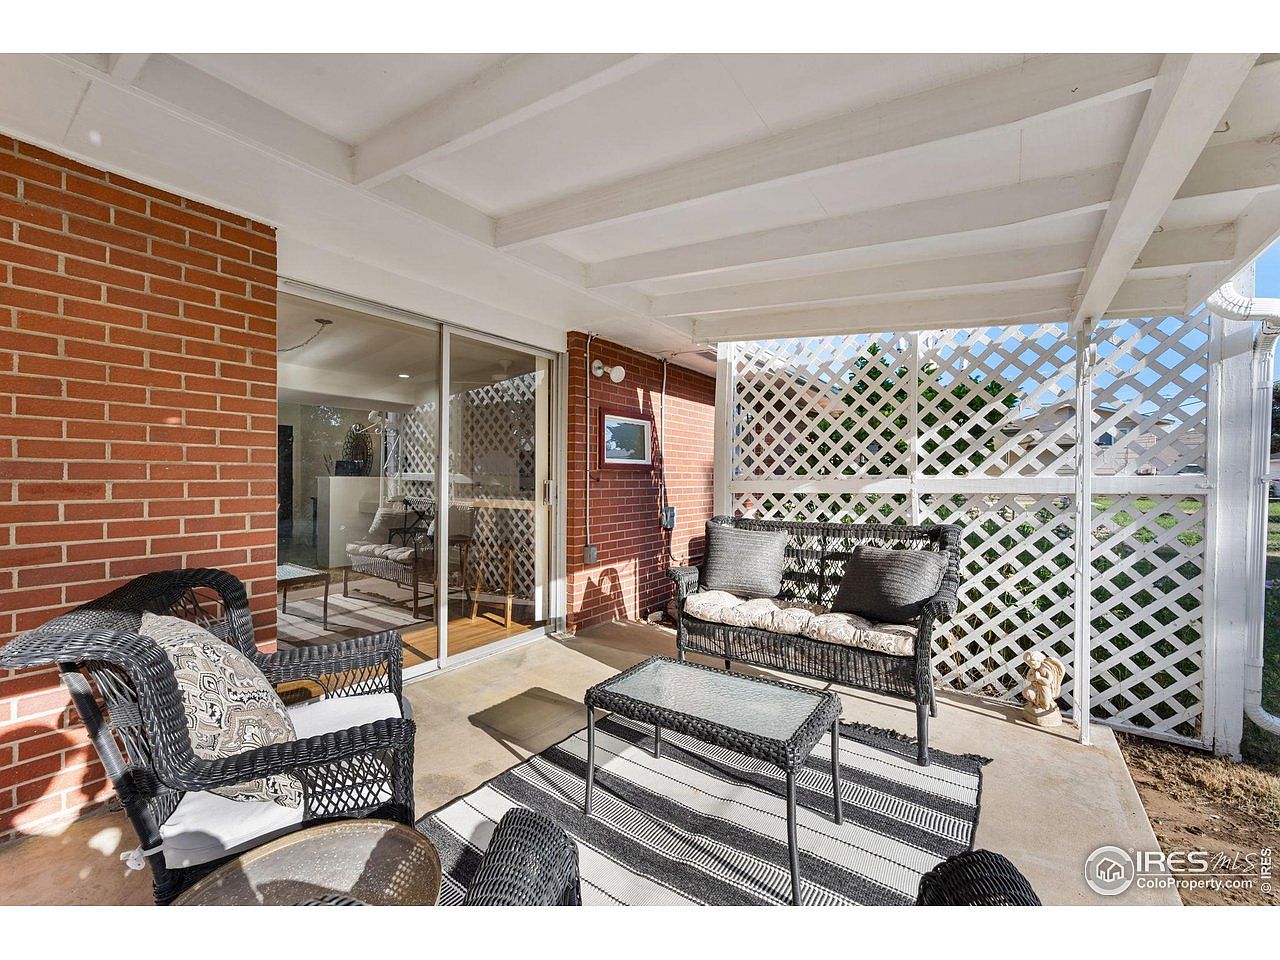
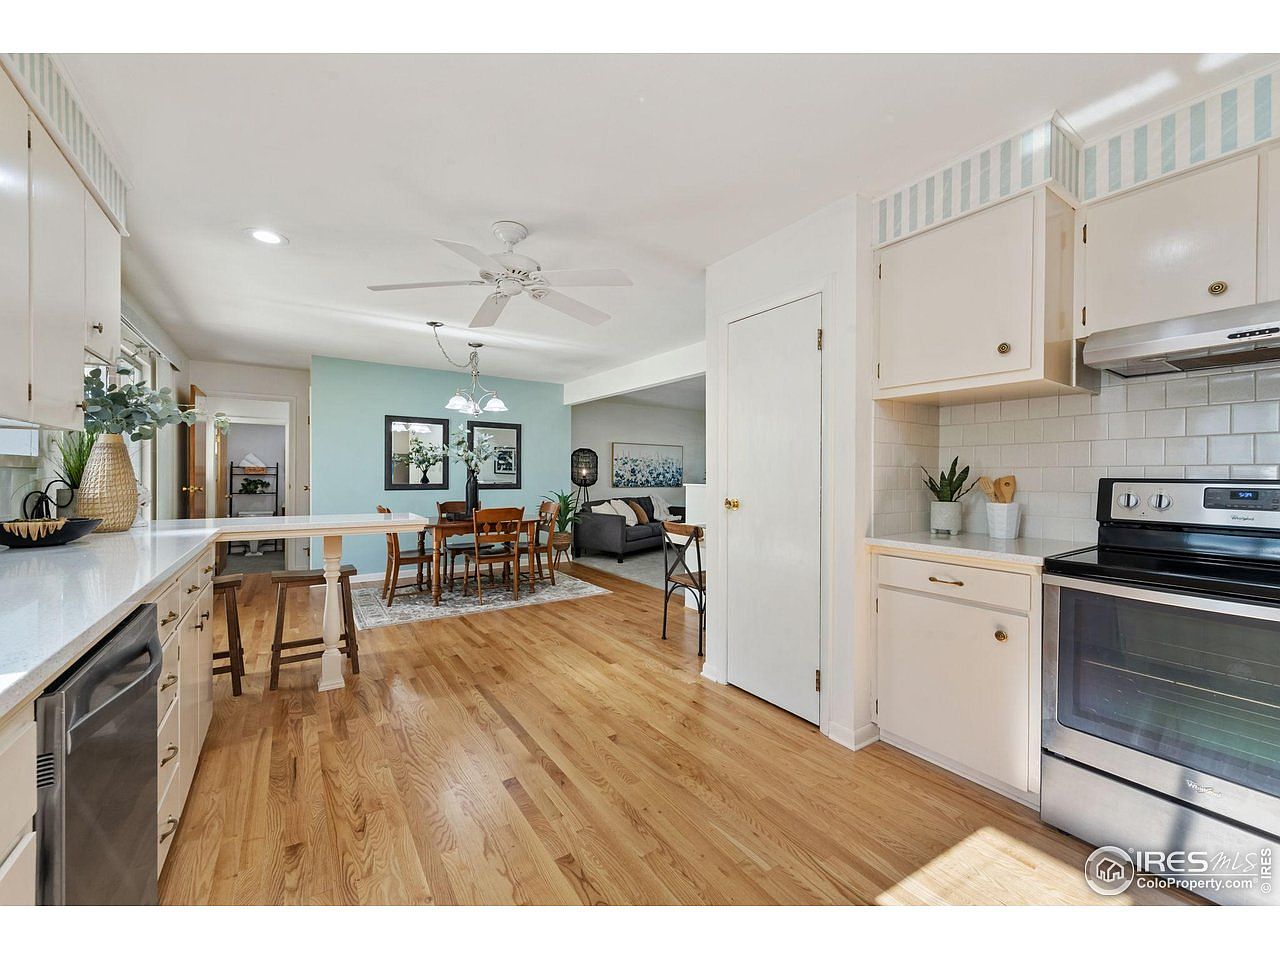
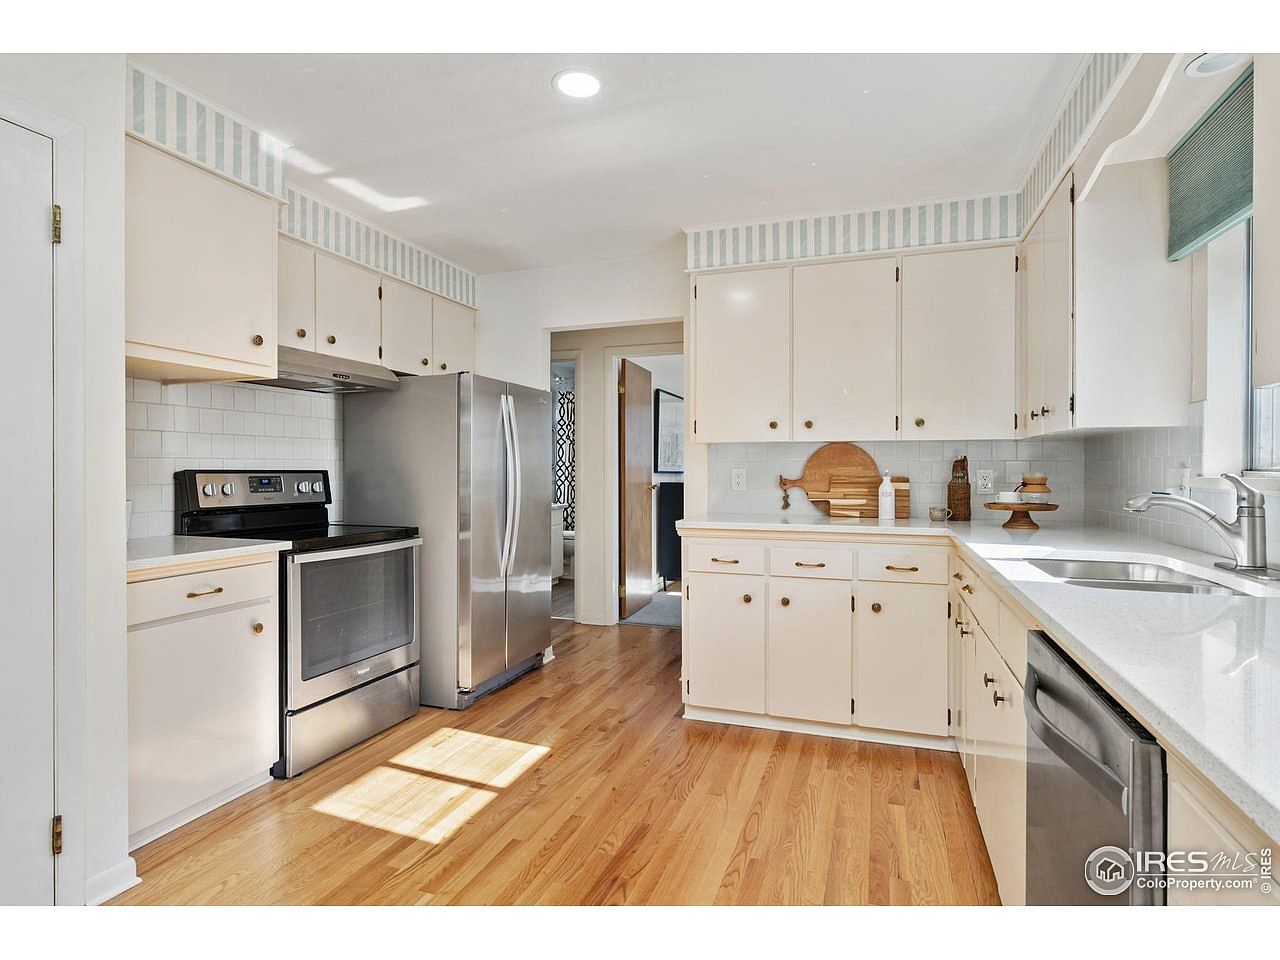
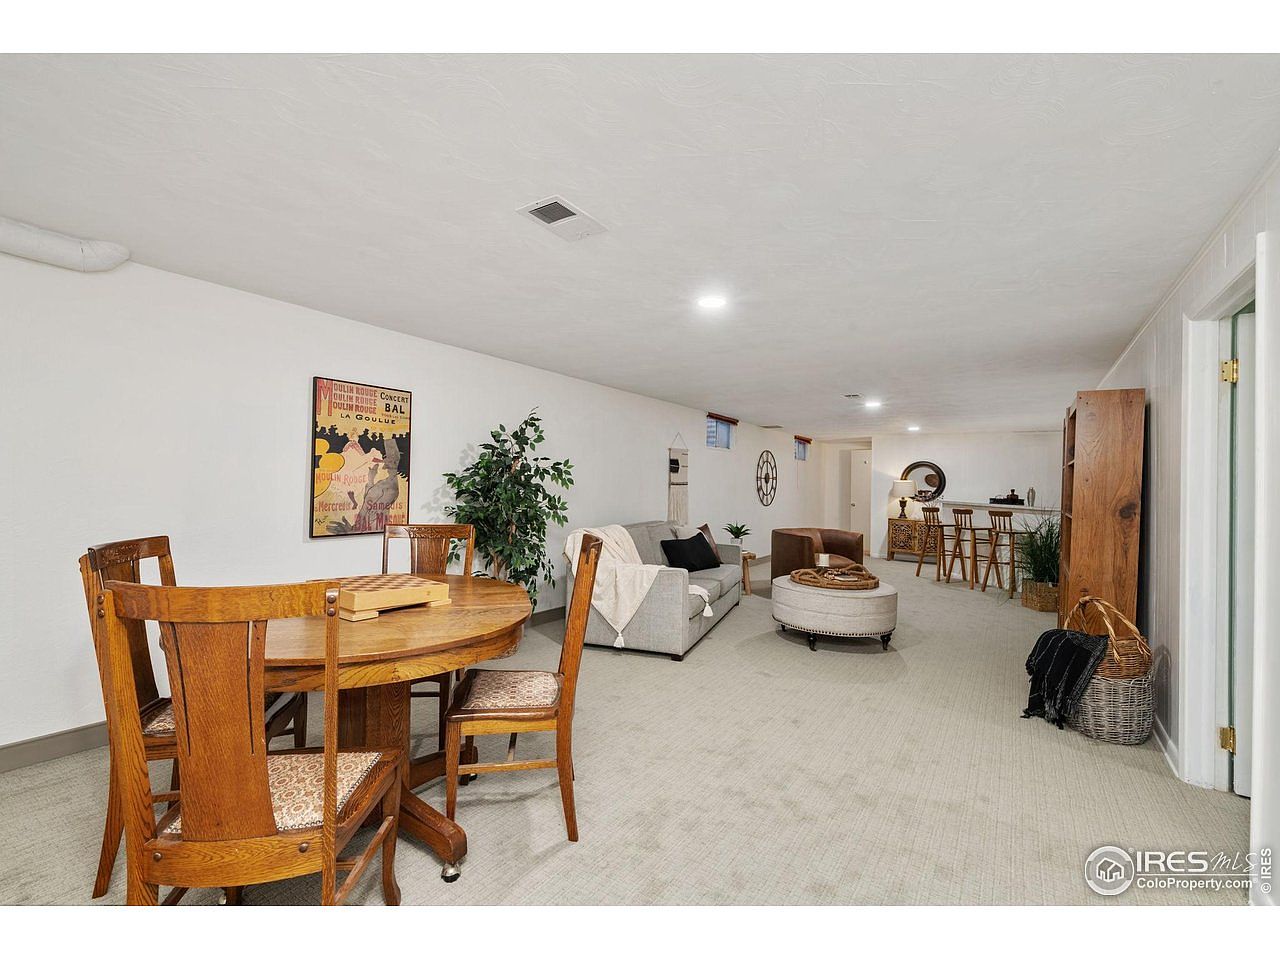
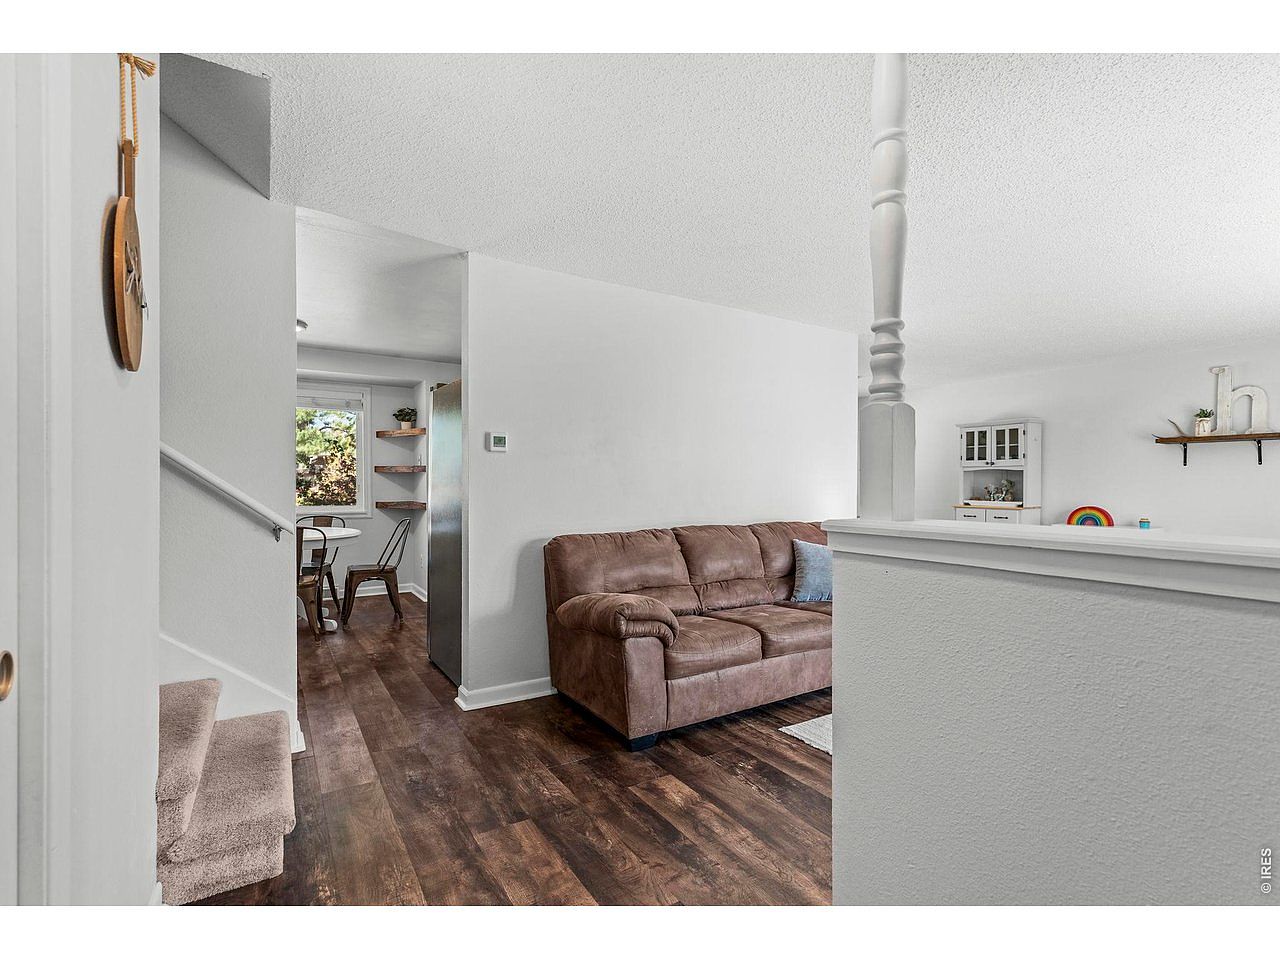
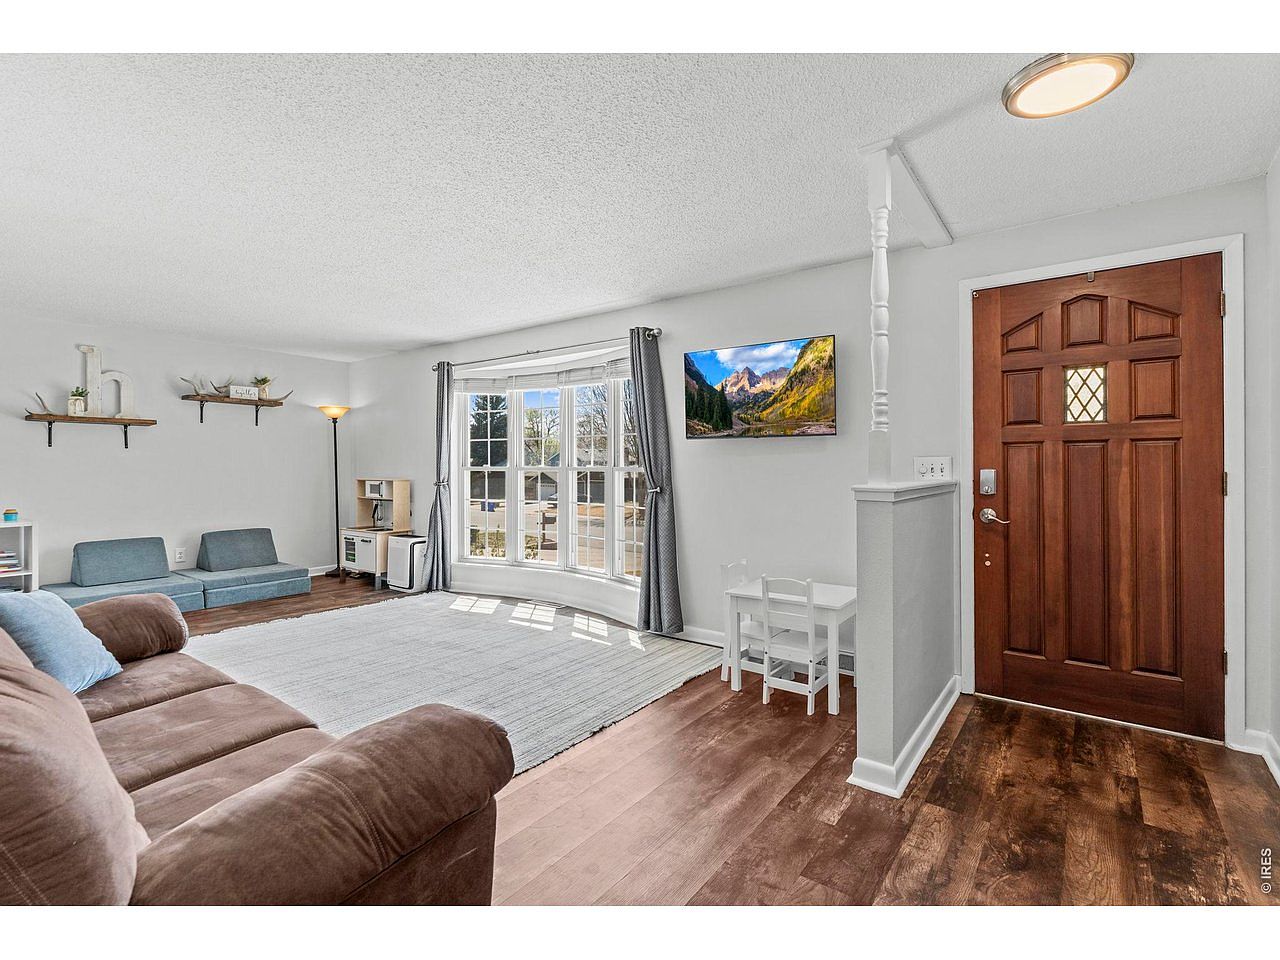
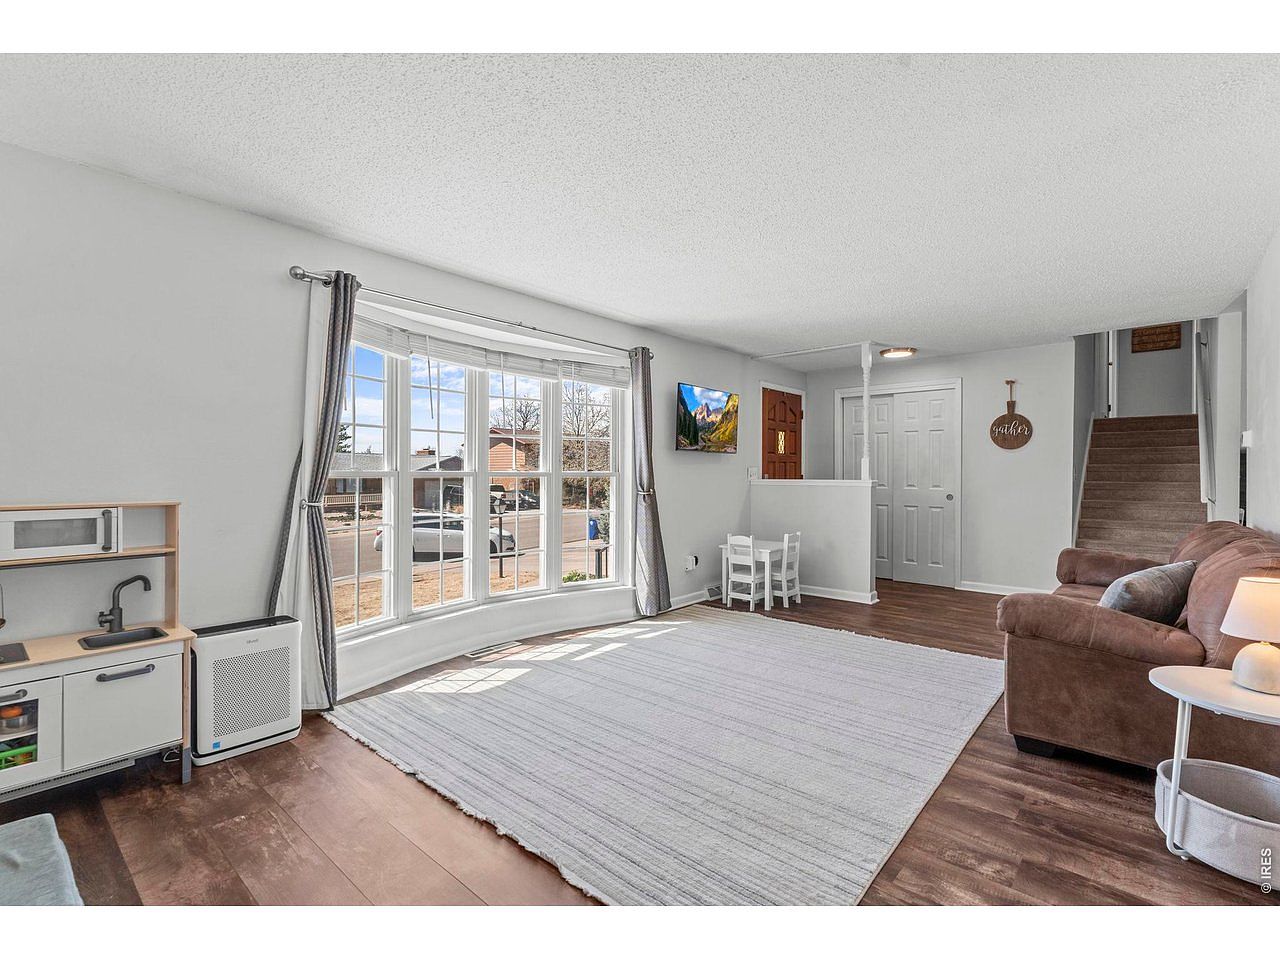
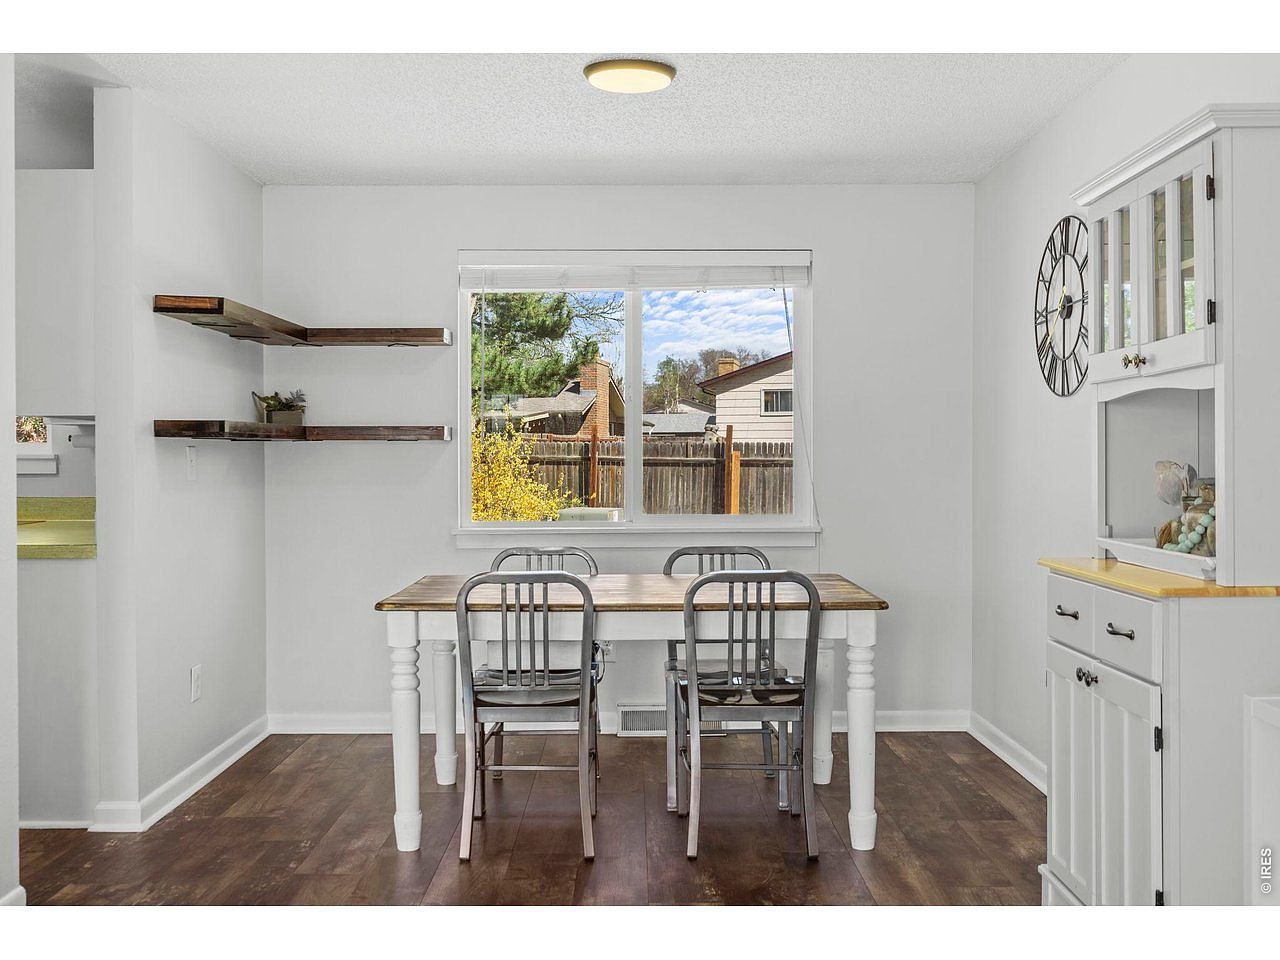
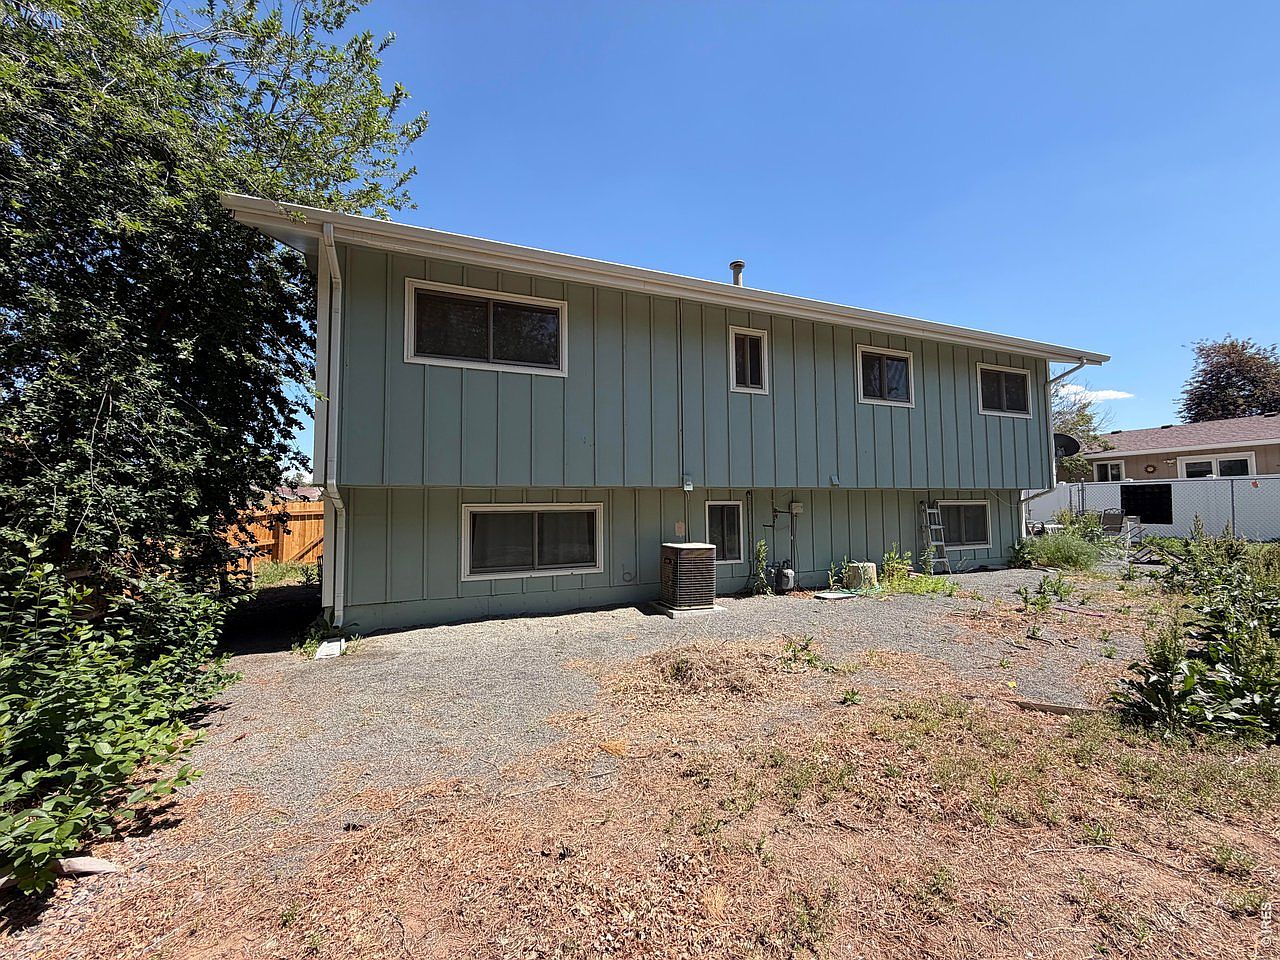
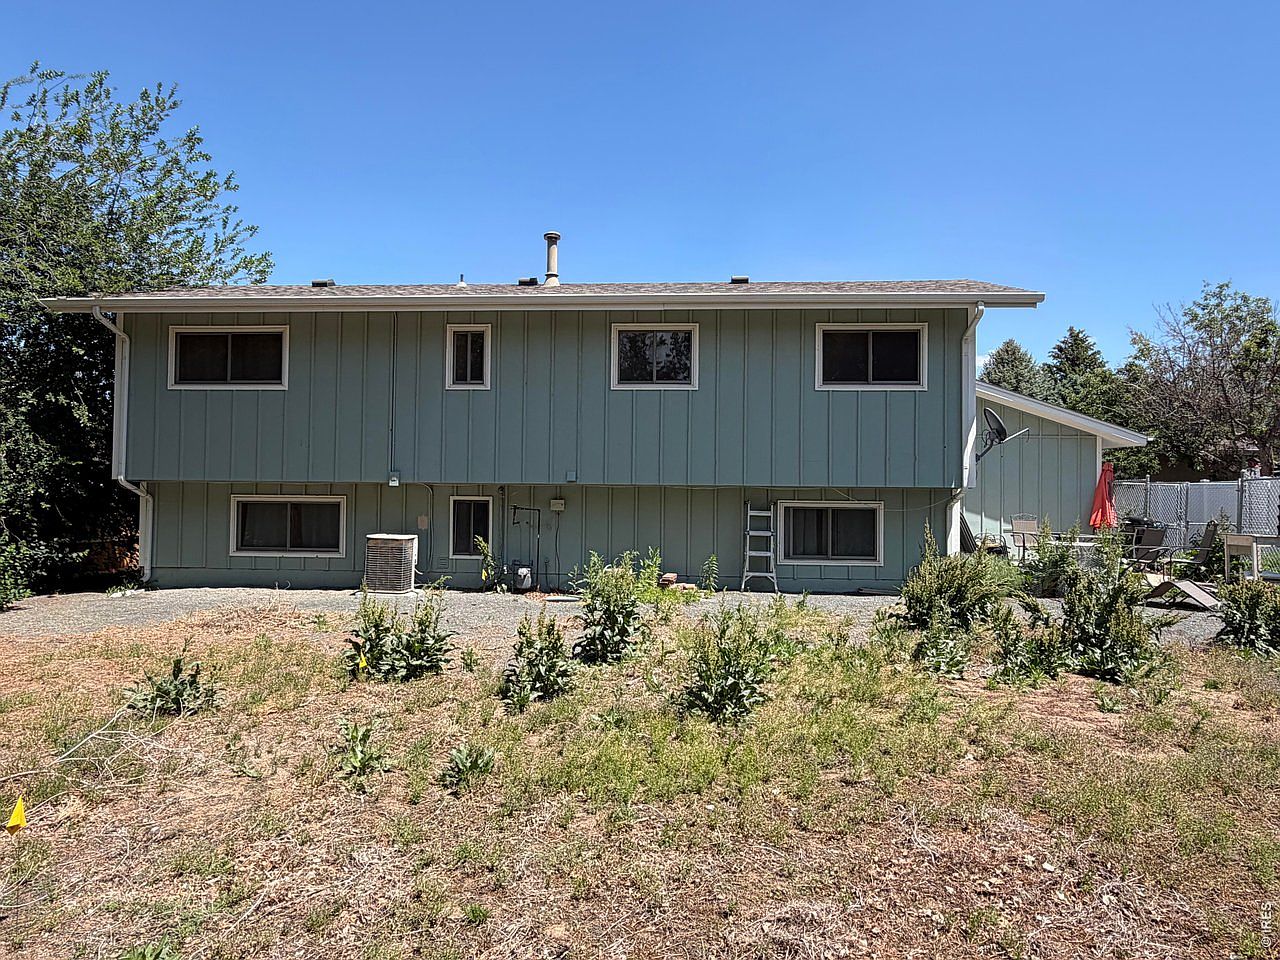
Your home: 2,392 sq ft · 4/2 · 2-car · built 1969
Source: MLS export of 375 listings, sales Aug 8, 2024 – Jul 13, 2026, data through Jul 13, 2026.
Your competition is the homes for sale today. Homes already under contract (pending or backup) are not counted as competition.
24
Similar homes for sale today
25
Including yours, once listed
How long do homes take to sell?
Half of the 257 homes that sold here were on the market 46 days or less (Aug 2024 – Jul 2026).
How many sell each month?
In a typical month about 11 homes sell while 24 are for sale, so roughly 46% of the homes for sale go under contract each month.
How busy is this market?
Sales averaged 11.1 a month (Aug 2024 – Jul 2026). The busiest month was December 2025, with 19 sales.
Homes for sale today, by asking price
Each bar counts similar homes for sale in that price range. The green bar is the range our recommended price falls in.
At $410,000, your home would be in the $400k–$425k range, alongside 7 of the 24 similar homes for sale today.
18
Under contract now
11.1
Sales per month, average
2.2
Months of supply
46%
Of homes for sale go under contract in a month
257
Homes sold
69
Expired or withdrawn, no sale
69 listings ended without a sale (71 expired, 5 withdrawn), not counting 7 that came back on the market within 45 days.
7
Taken off, relisted within 45 days
7 listings came off the market and were listed again within 45 days. They are counted here instead of as unsold.
$400k
Median sold price
46
Median days on market
$197
Median sold price per sq ft
Sales, prices, and days on market cover Aug 2024 – Jul 2026 (257 sales). For sale and under contract are as of Jul 13, 2026. Months of supply = homes for sale ÷ average sales per month.
2The Supply StreamSupply rising
About 15 similar homes have listed each month lately, while about 11 sell each month. More homes are listing than selling.
The homes for sale today are a snapshot. New listings keep arriving while yours is on the market, and they compete for the same buyers.
New listings vs sales, per month
15.2
New listings a month
Average, Feb 2026 – Jul 2026
11.1
Sales a month
Average, Aug 2024 – Jul 2026
New listingsSales
Supply rising
More homes are listing than selling
New listings have been coming on faster than homes sell, so buyers have more to choose from. When that happens, homes priced above the market tend to sit longer.
1.37
New listings for every sale
+4.1
More listings than sales, per month
New listings and sales by month
Light blue = similar homes newly listed that month. Dark blue = similar homes sold that month. When light blue runs taller, the number of homes for sale grows. Jul 2026 is a partial month (data through Jul 13).
New listings averaged 15.2 a month over the last six months (Feb 2026 – Jul 2026). Sales averaged 11.1 a month over 23 months (Aug 2024 – Jul 2026). More homes are listing than selling.
3Closest Comparable Sales
Ranked by how closely each sale matches your home on size, beds, baths, age, garage, and how recently it sold. Tap a home to see its photos and full details.
How these sales were picked
We score every sold home in this market against yours. Living area counts most, then beds, year built, baths, and garage. More recent sales score higher. Sales whose price is far out of line for their size are left out. The match % compares each sale to the best match on this report, so #1 is always the closest fit. Prices shown are final sold prices from the MLS; the list price is the last asking price before the sale.
Closest matches · picked automatically
1 / 5
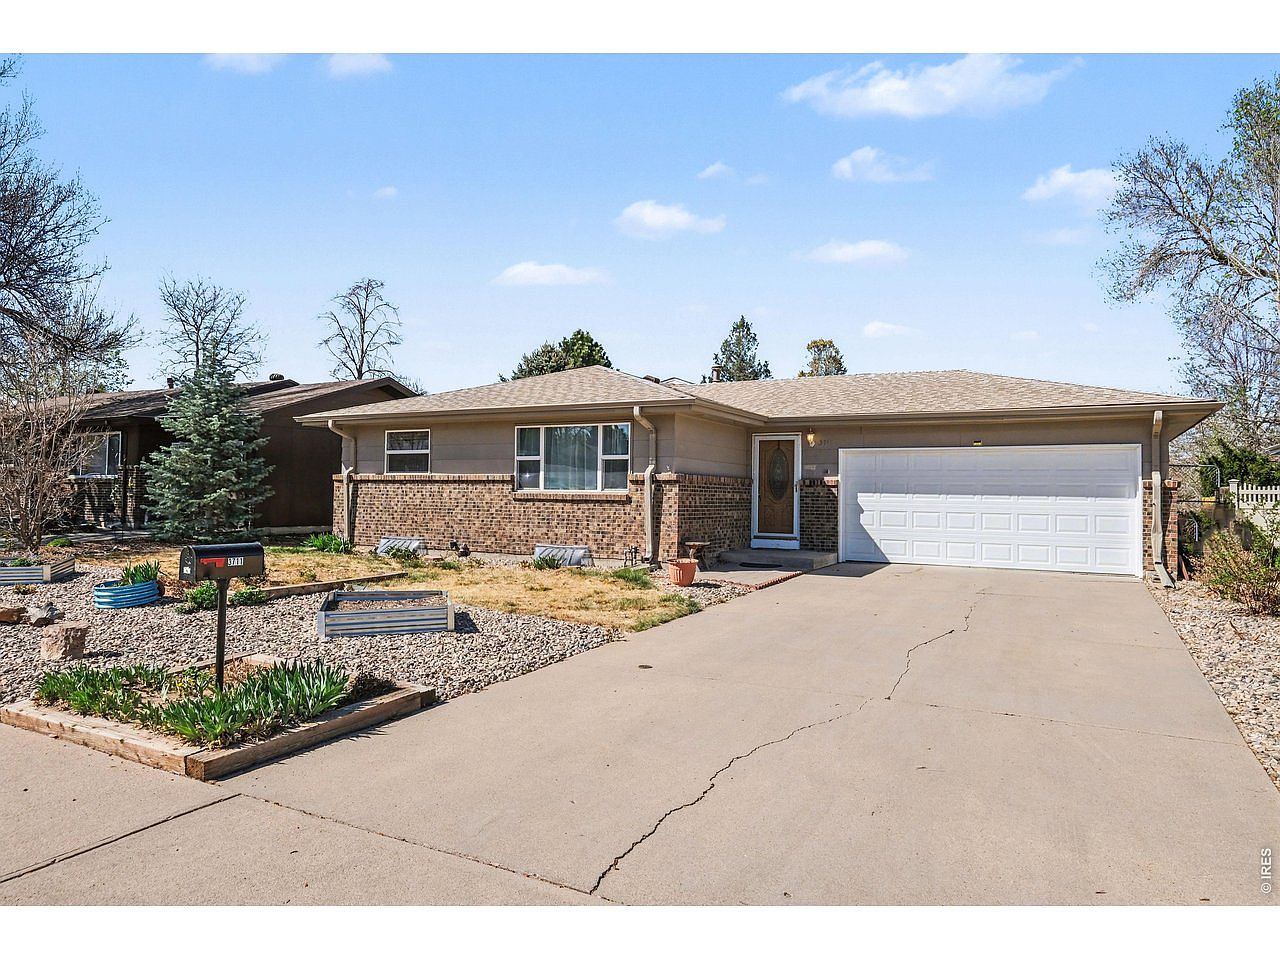
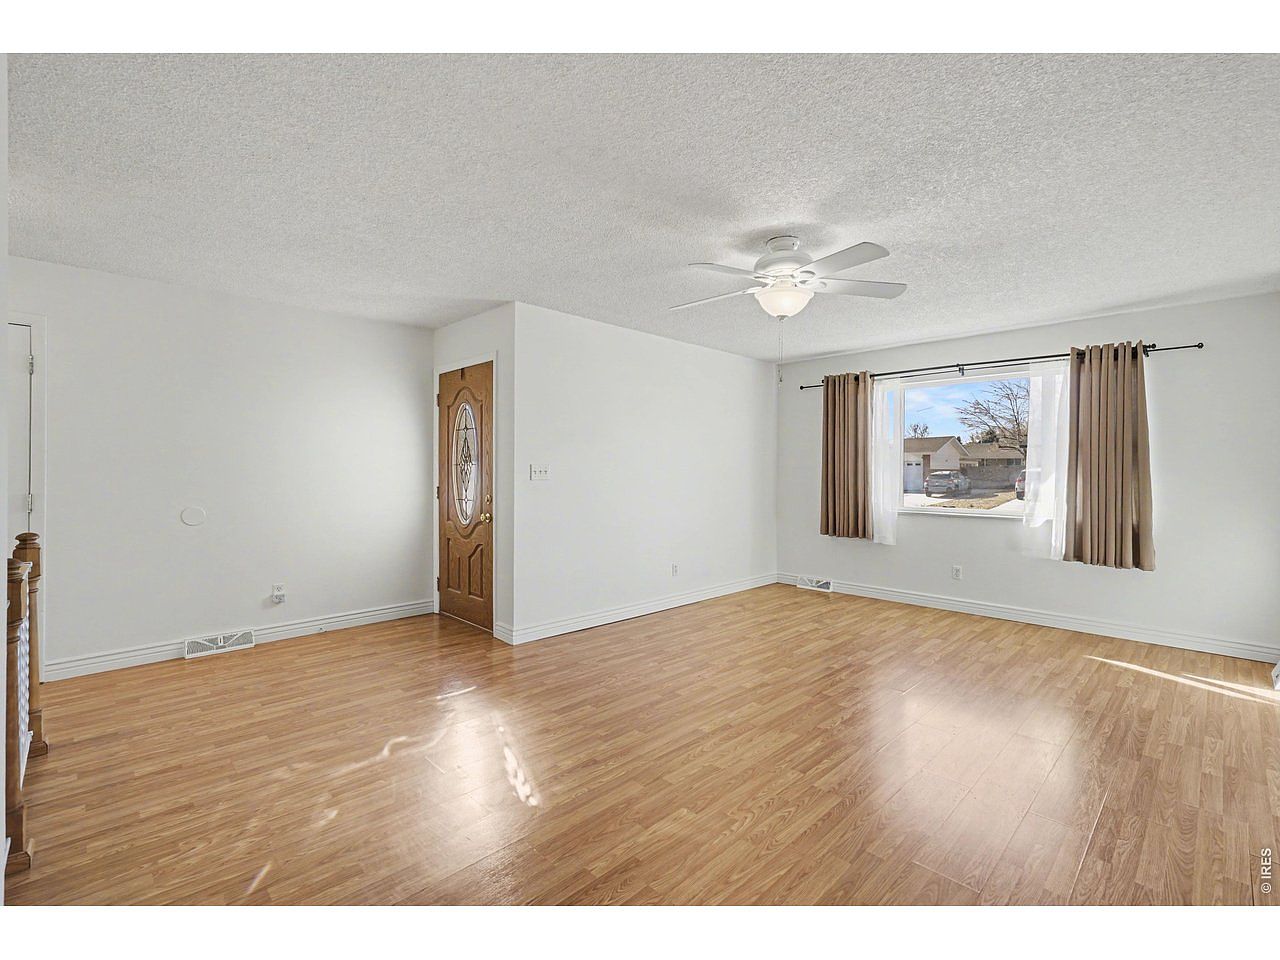
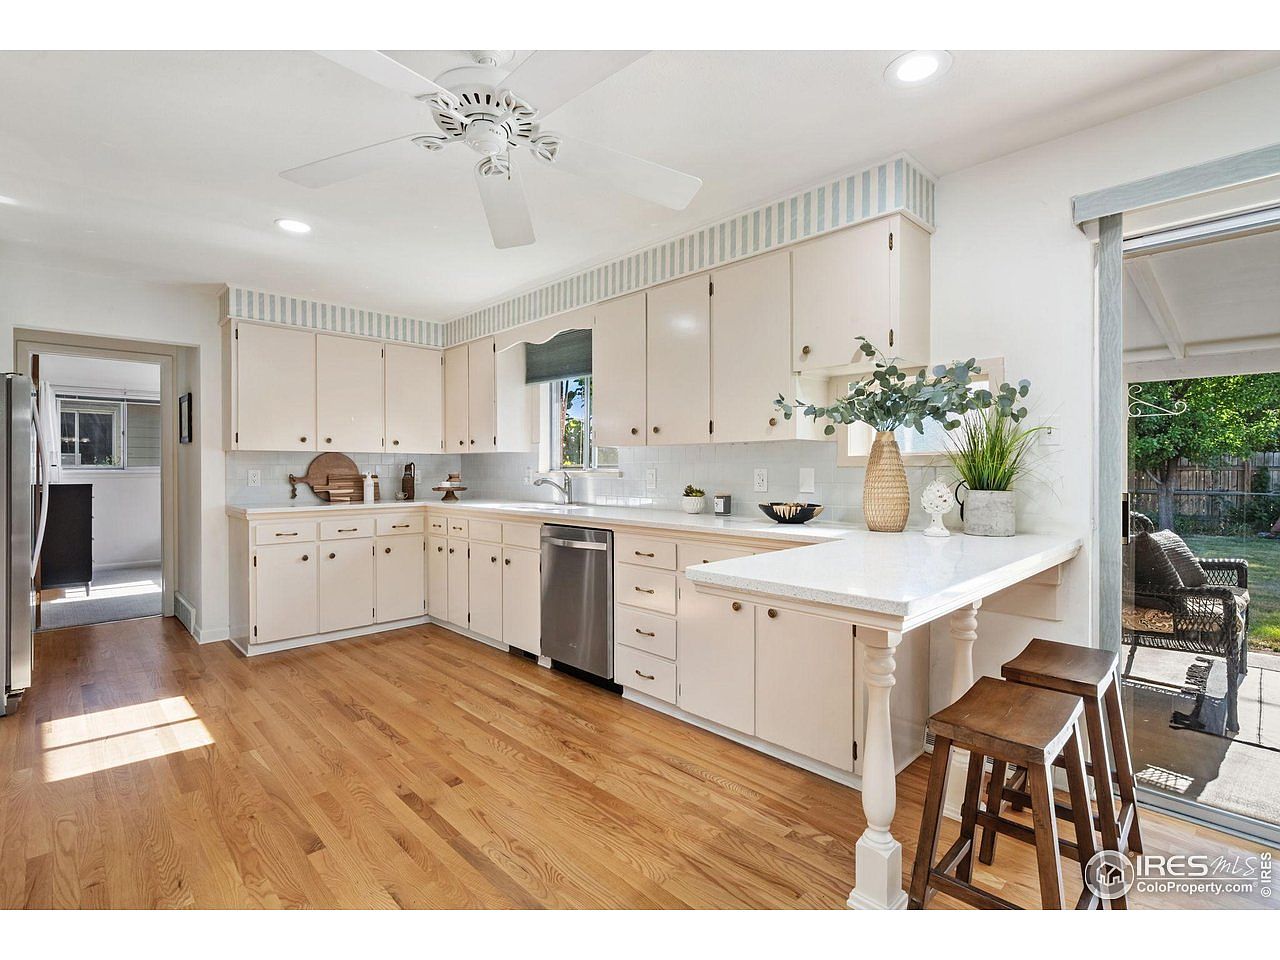
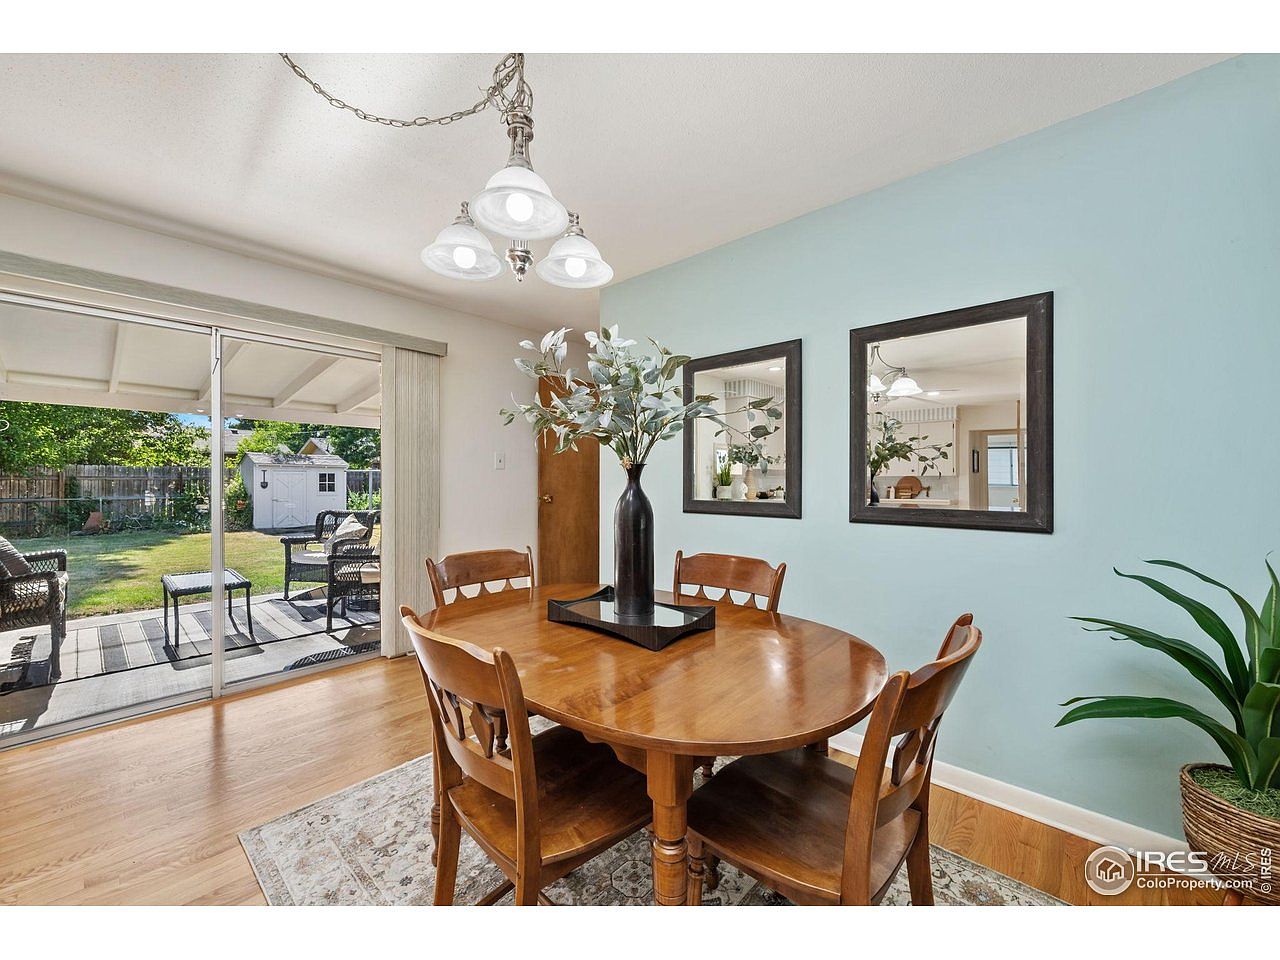
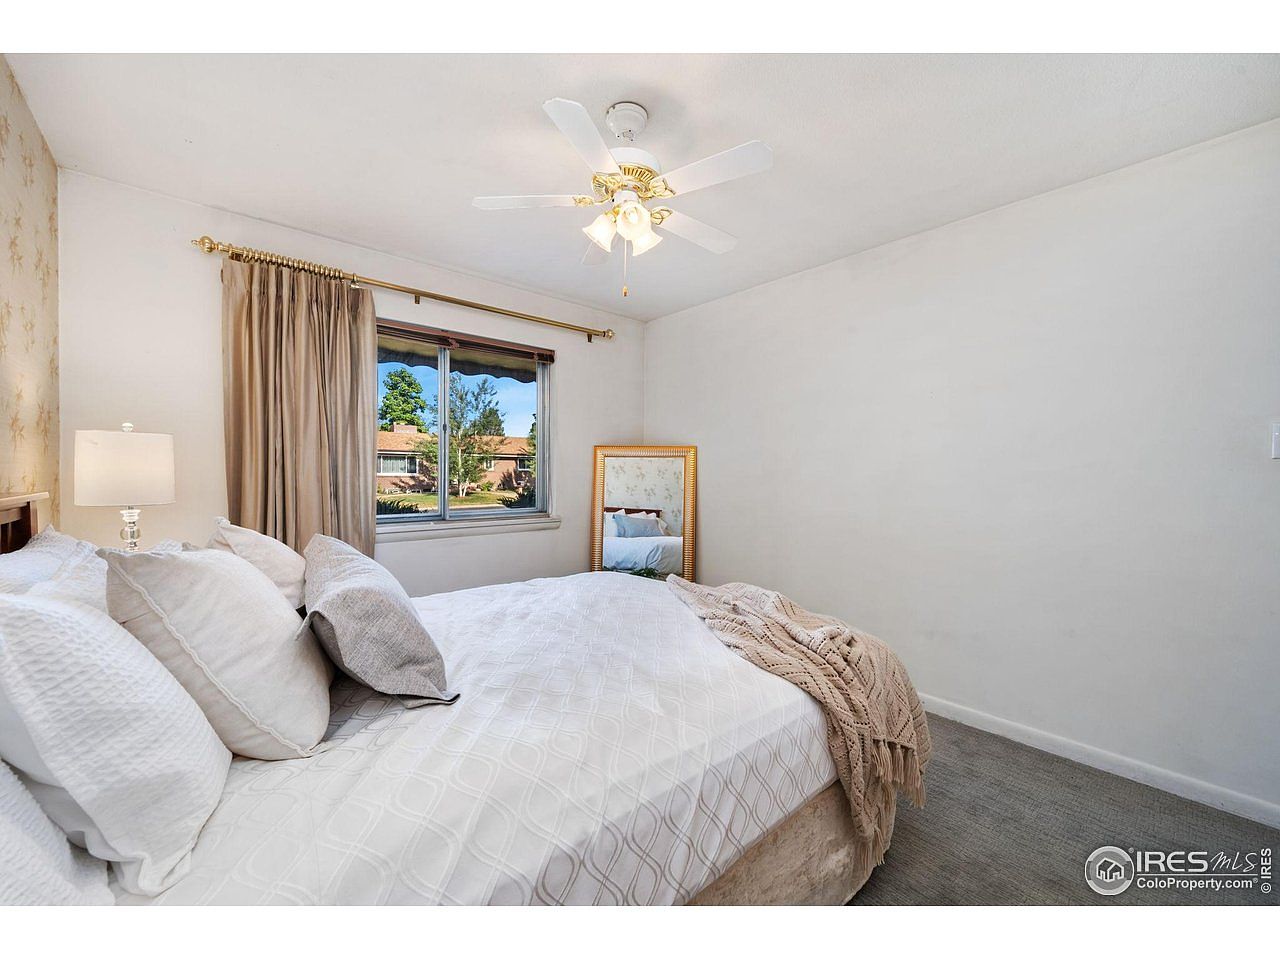
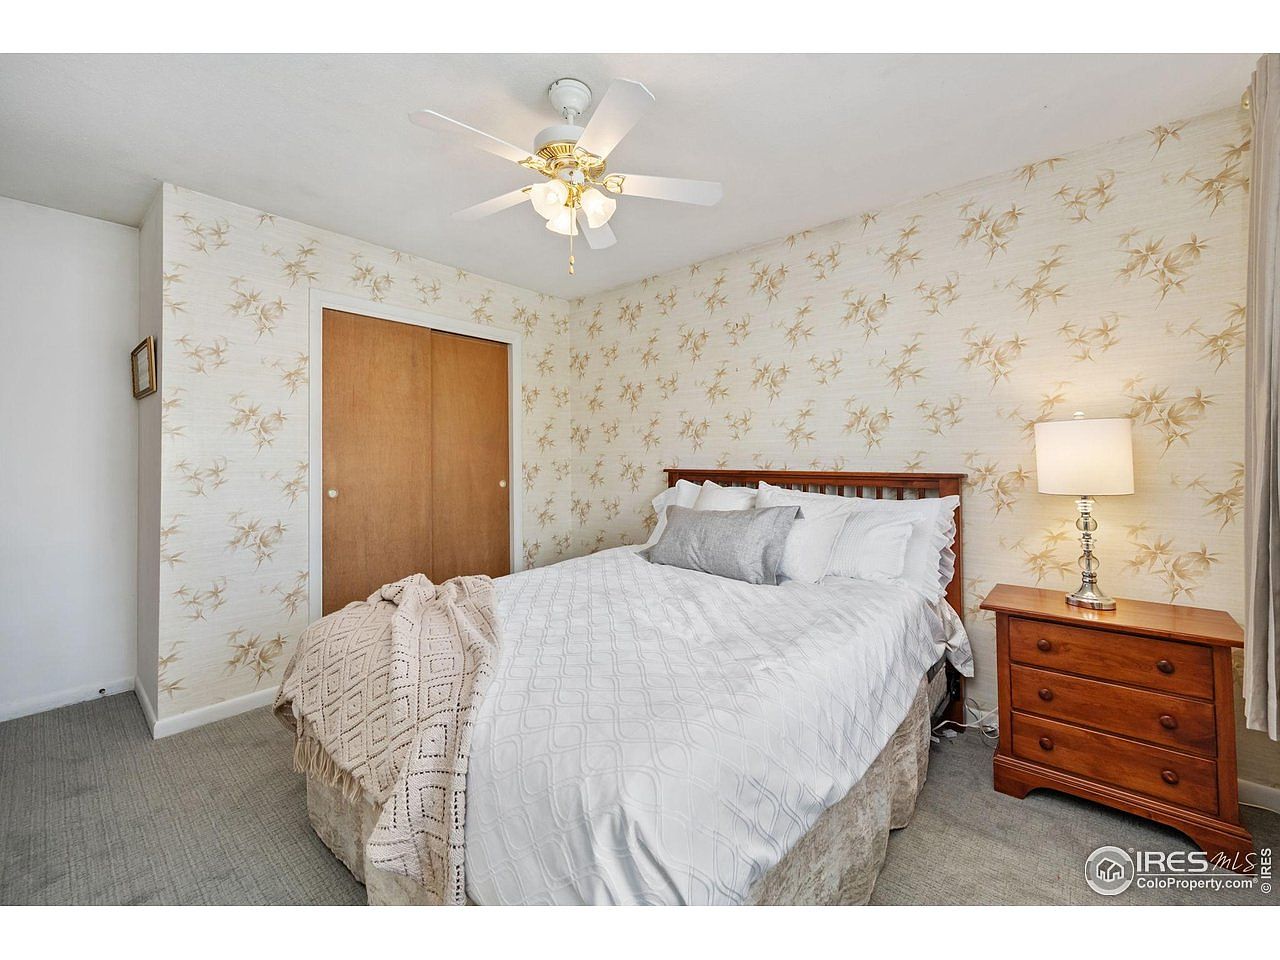
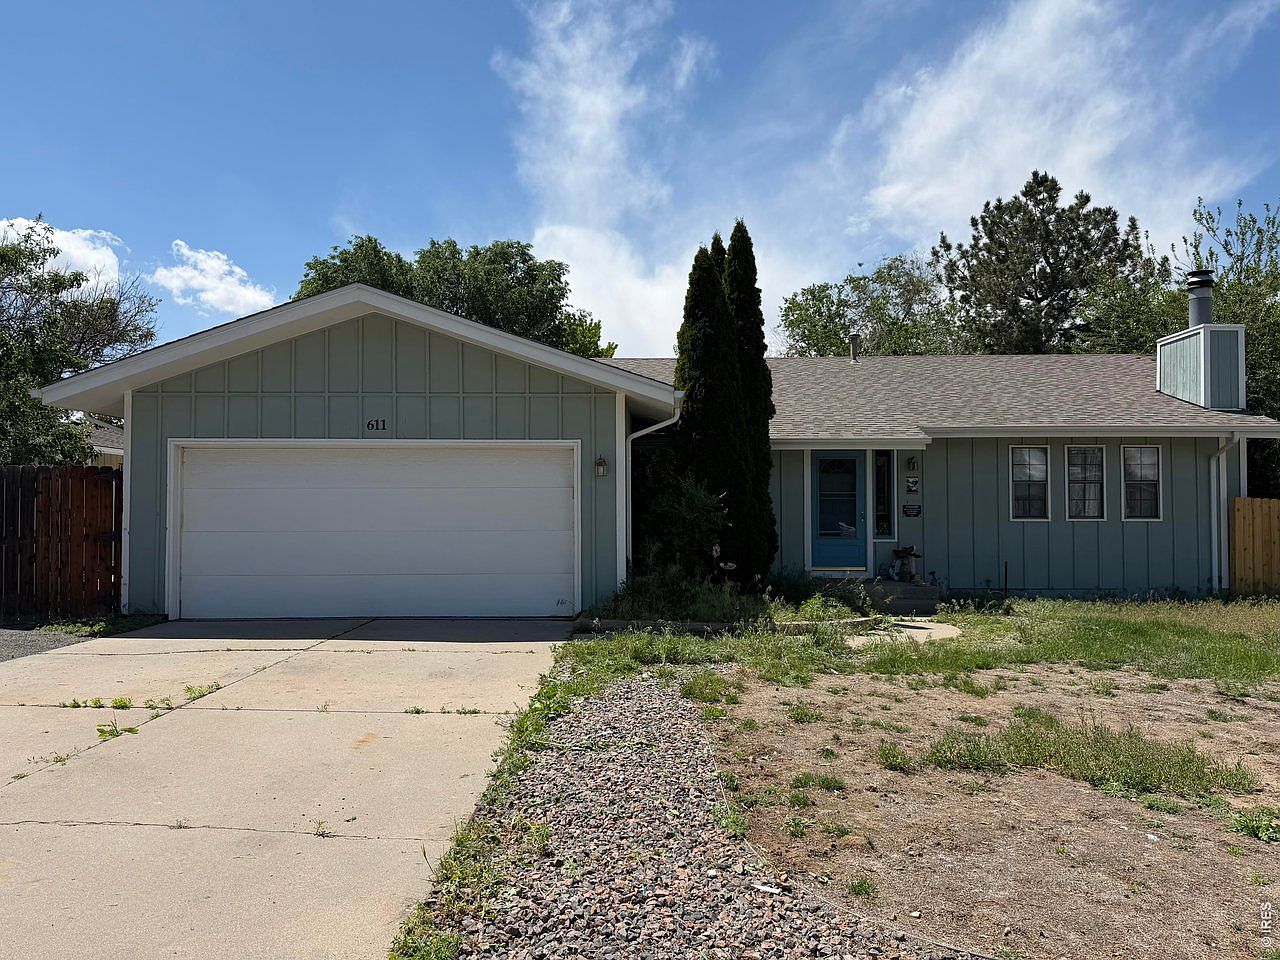
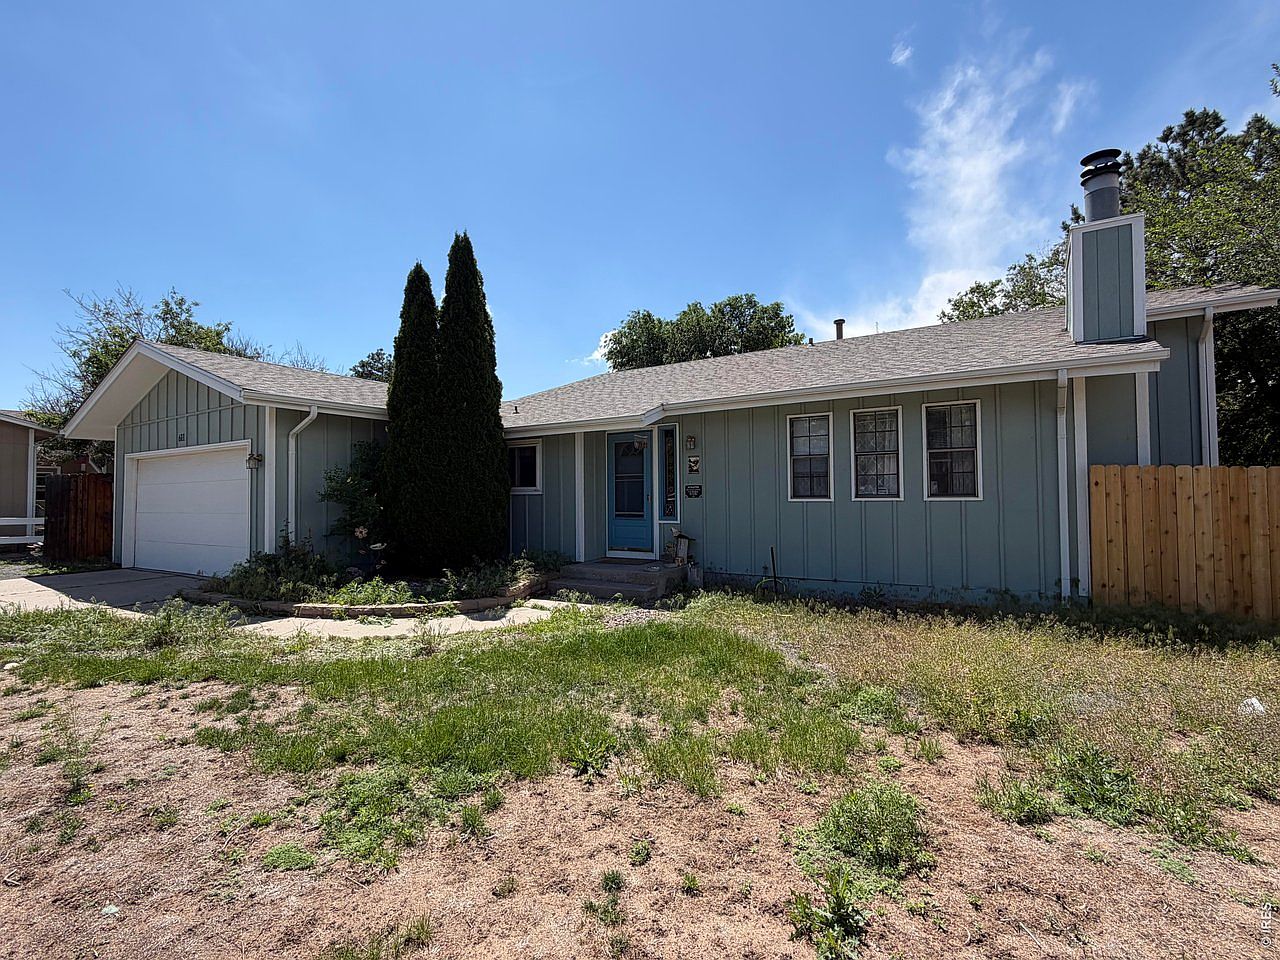
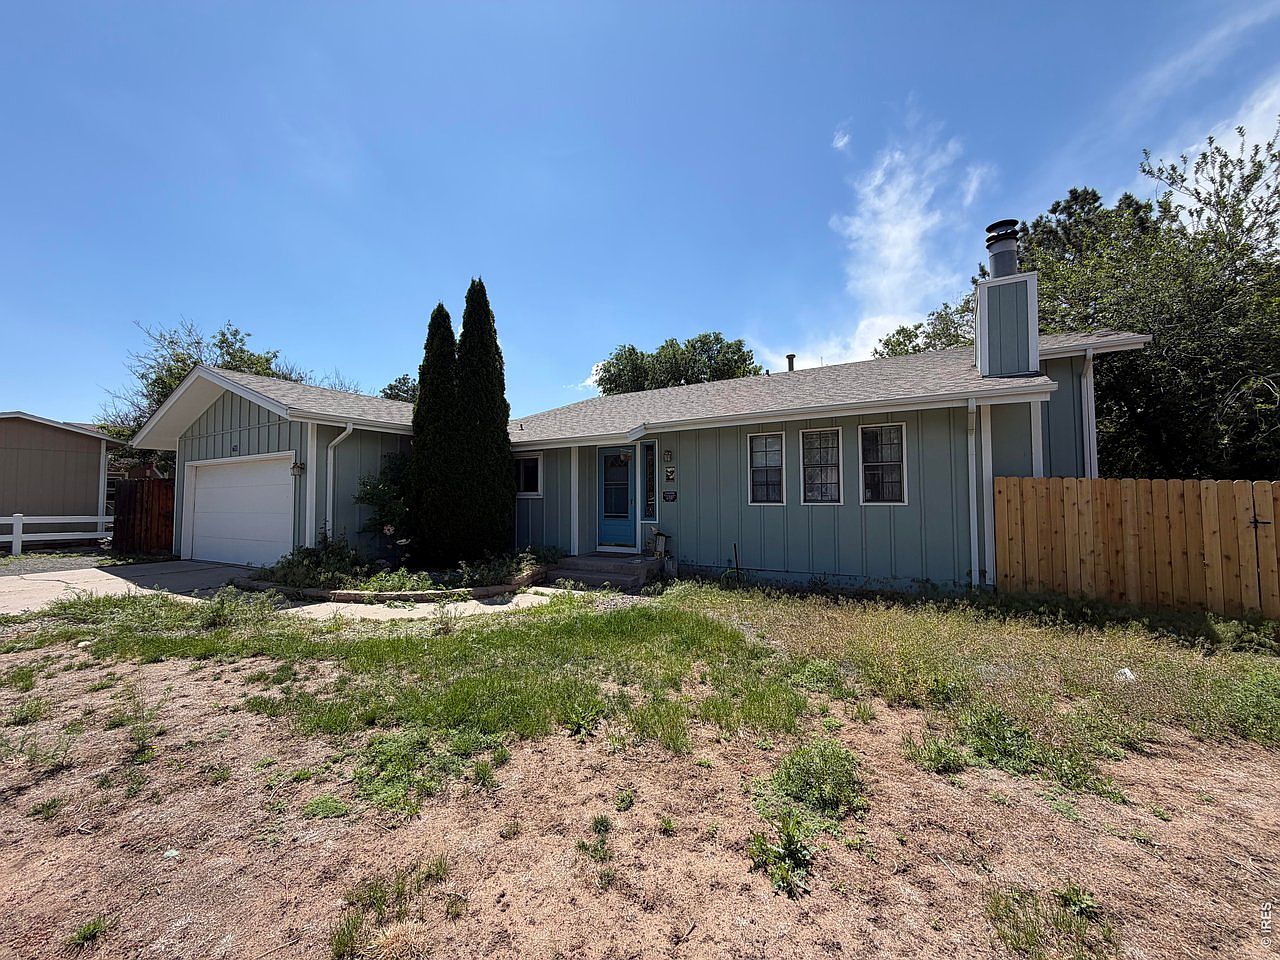
The home we are pricing
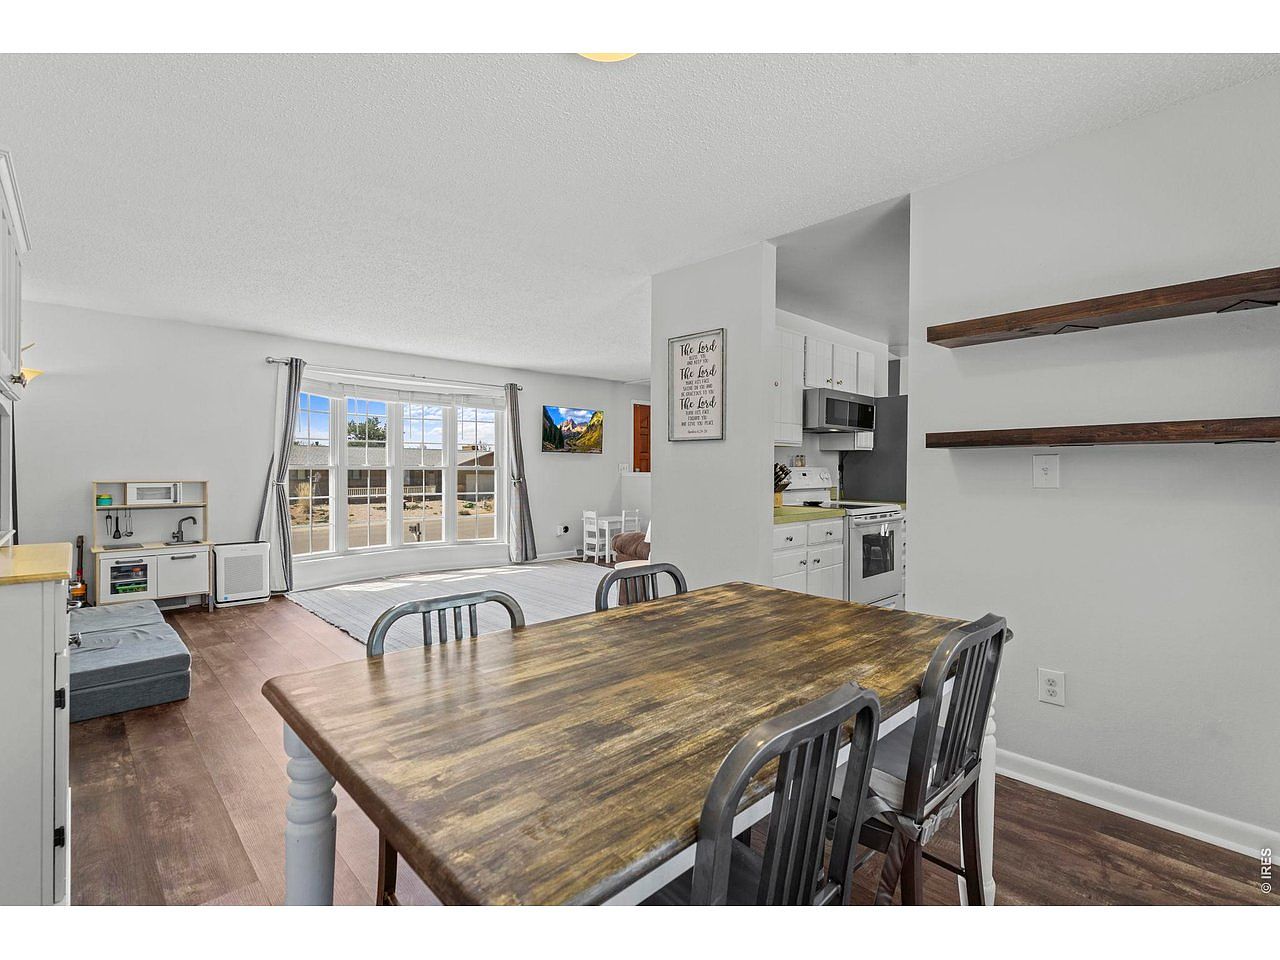
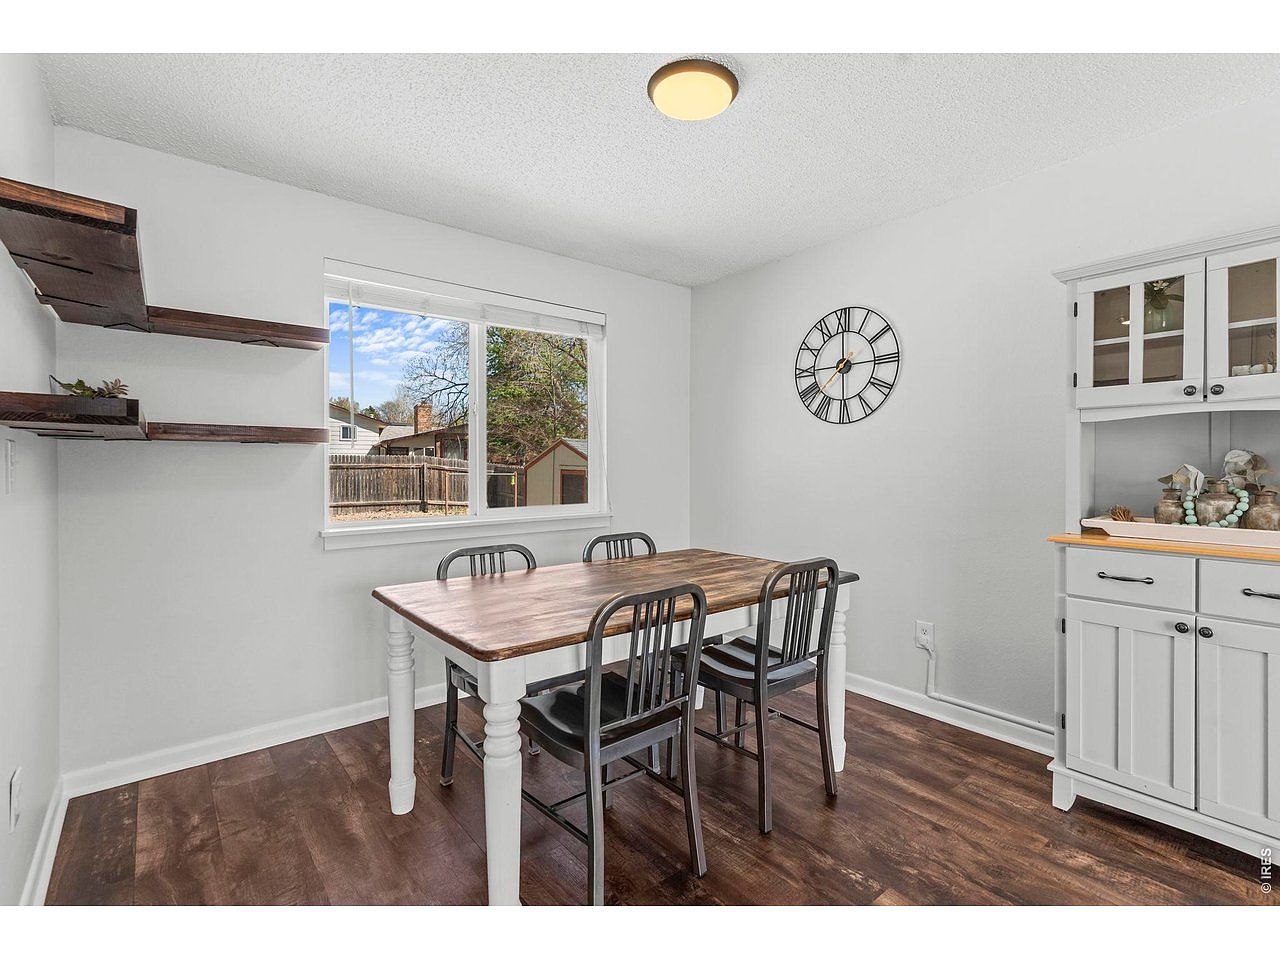
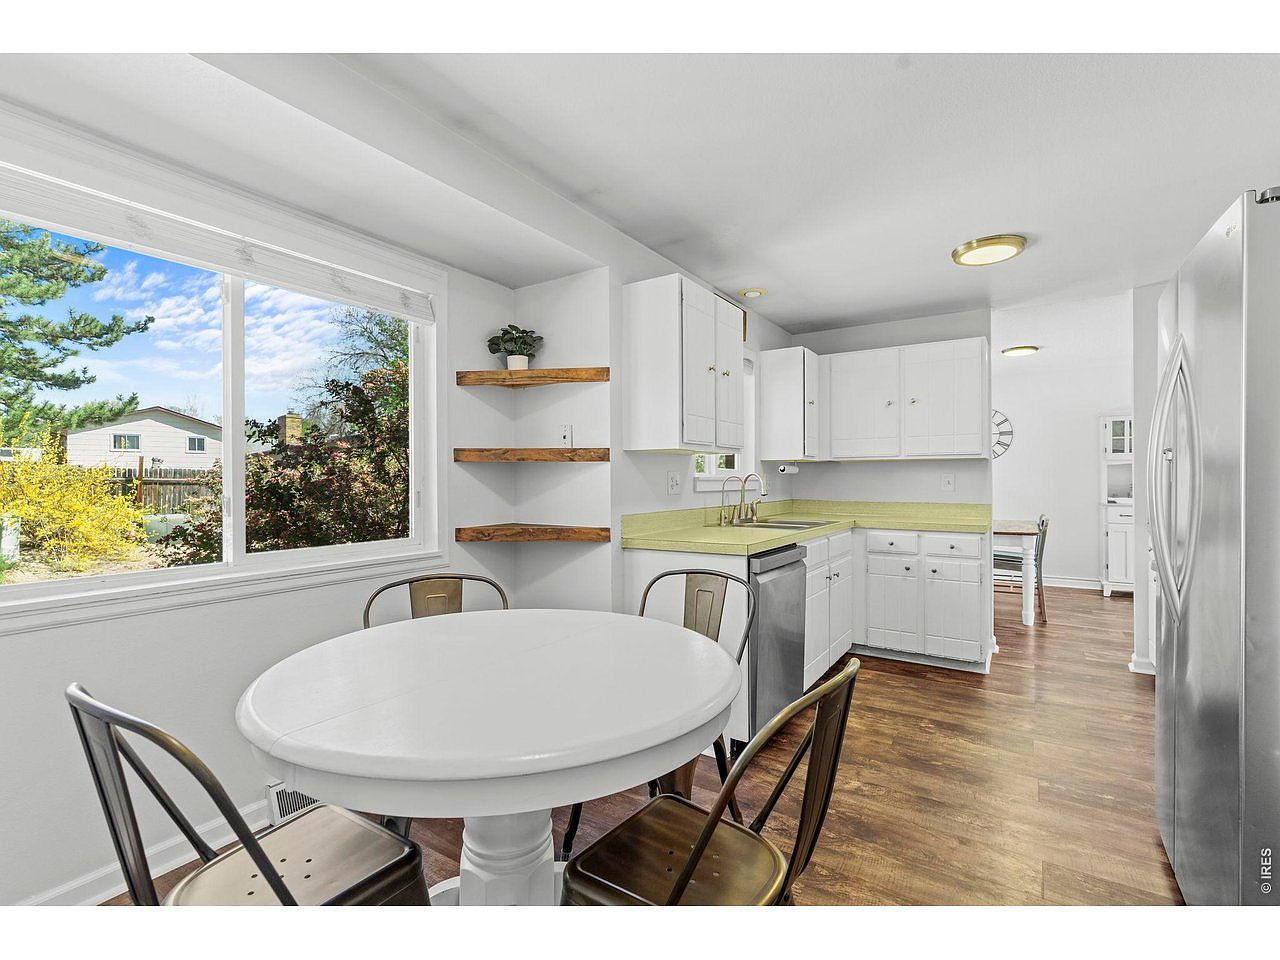
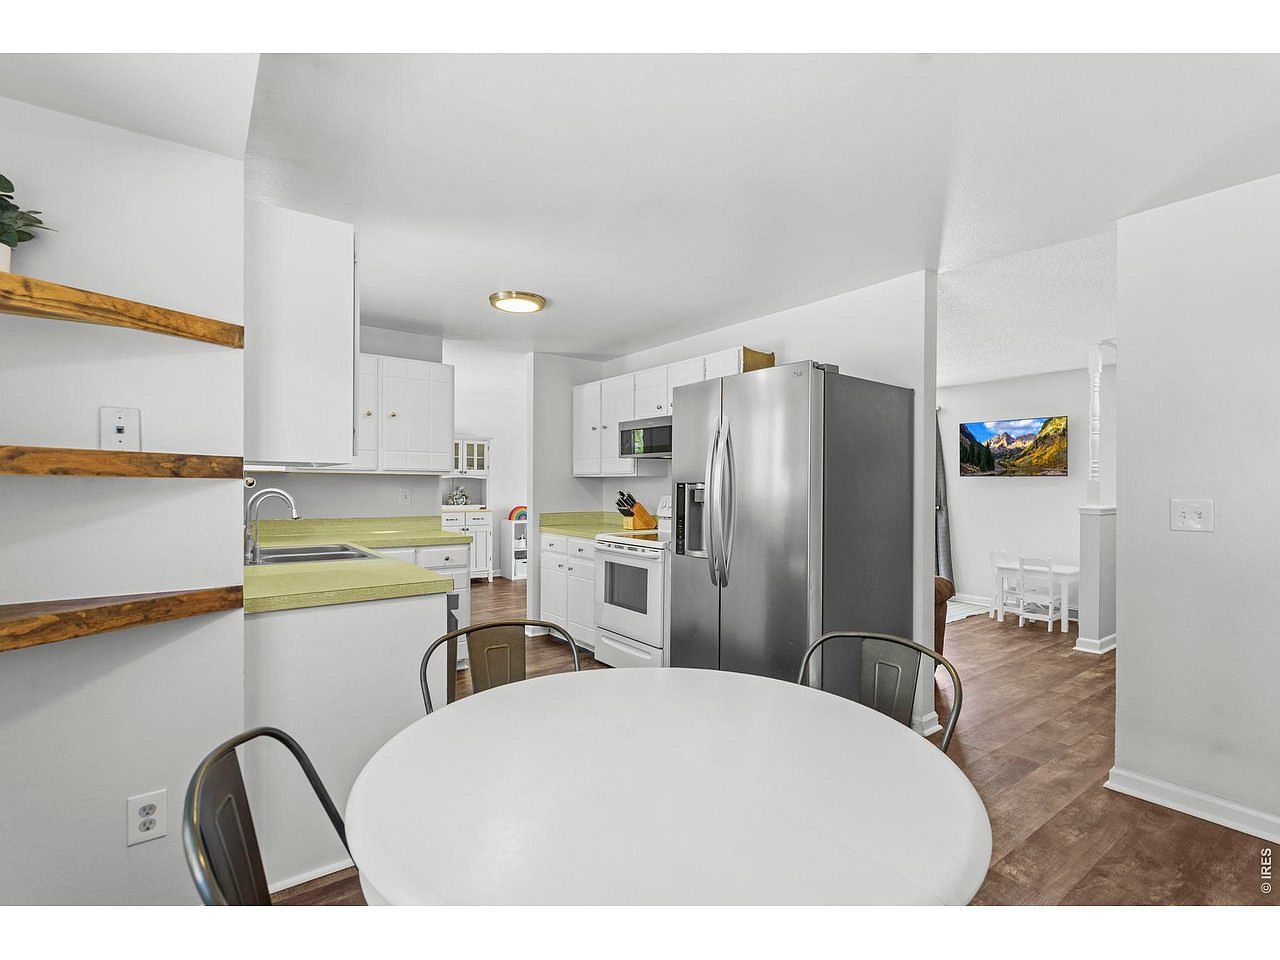
Your home
Compare each sale below to this
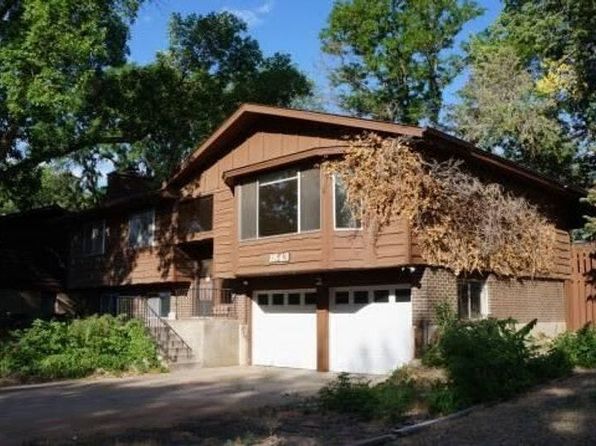
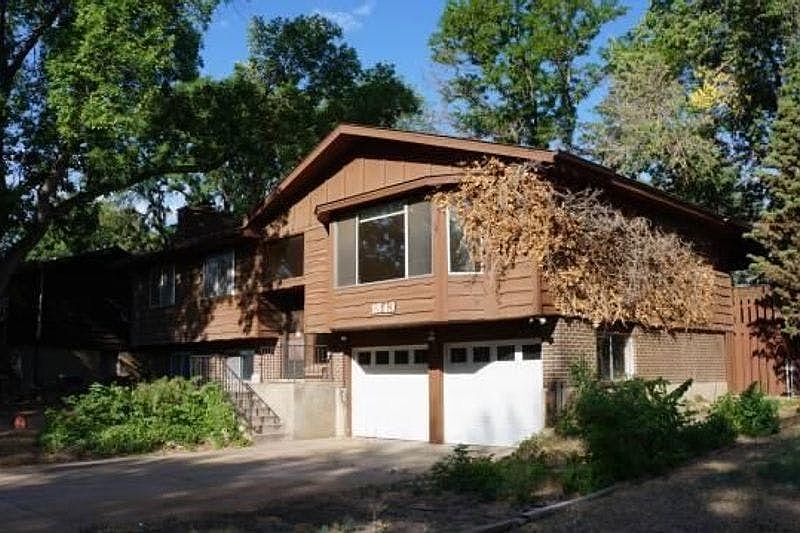
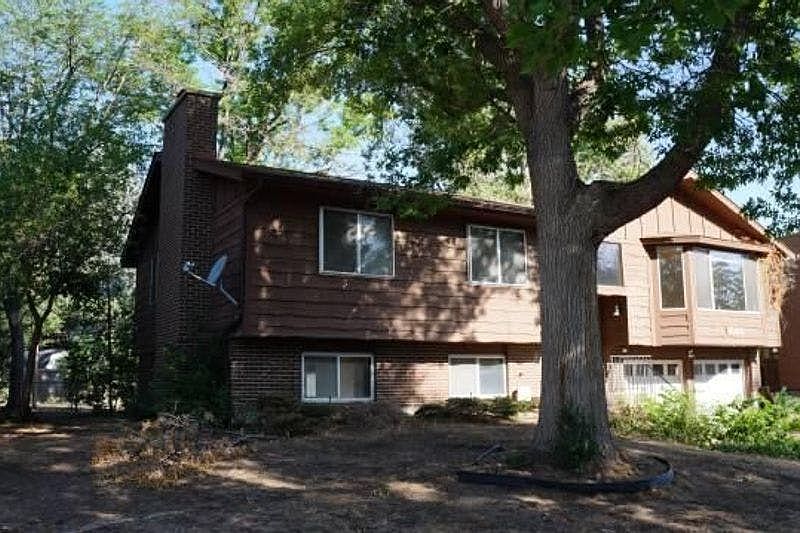
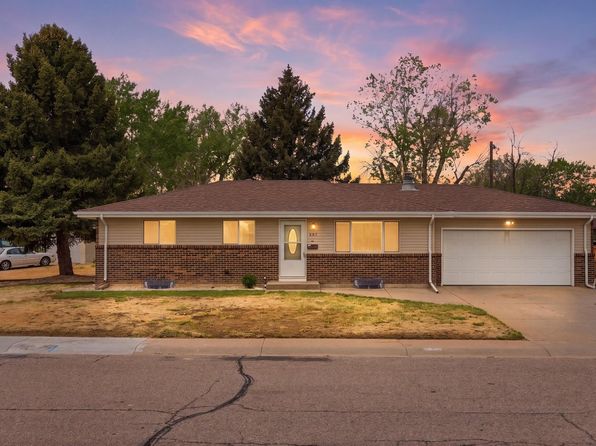
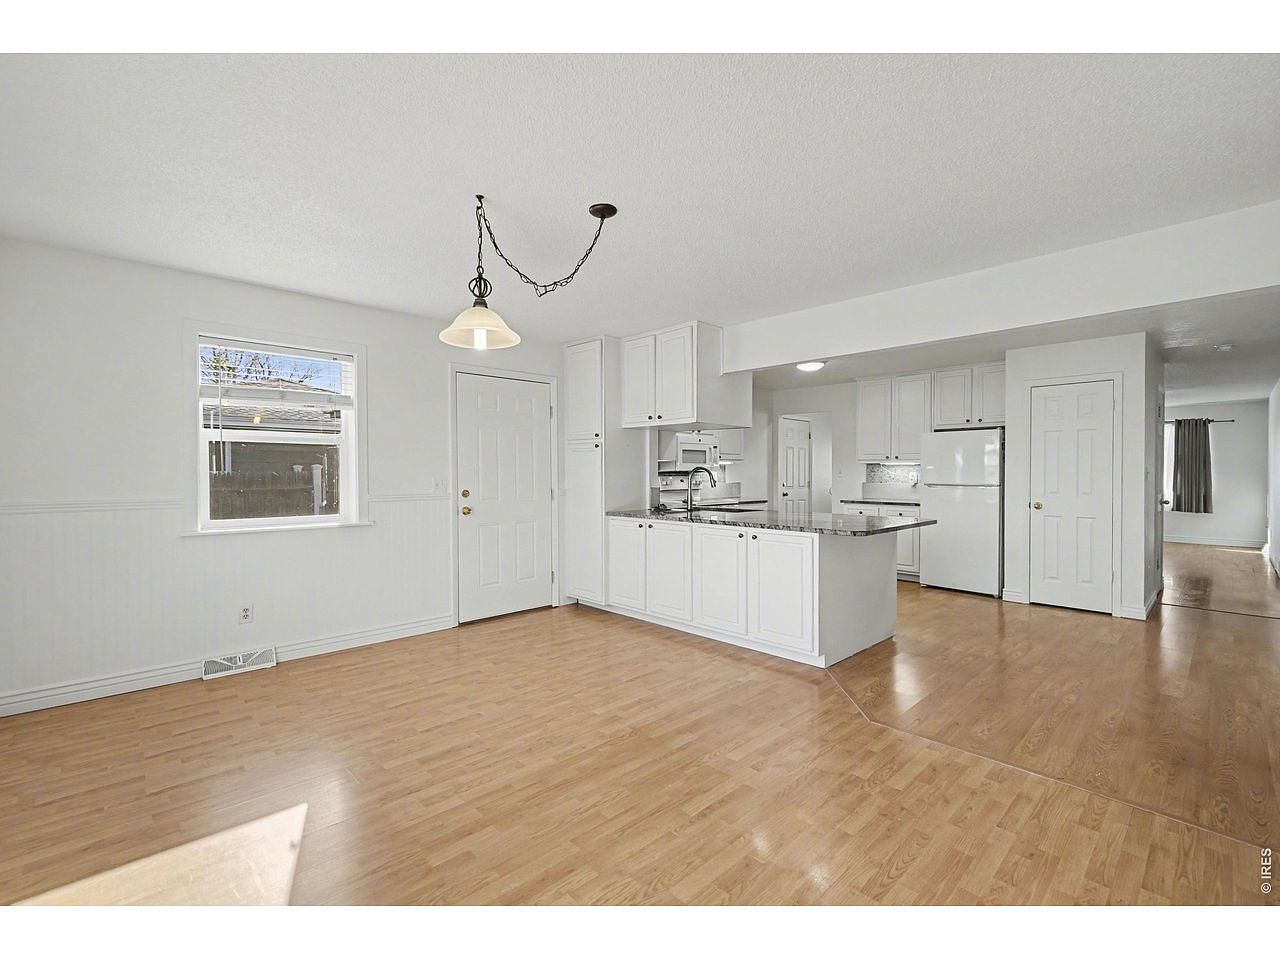
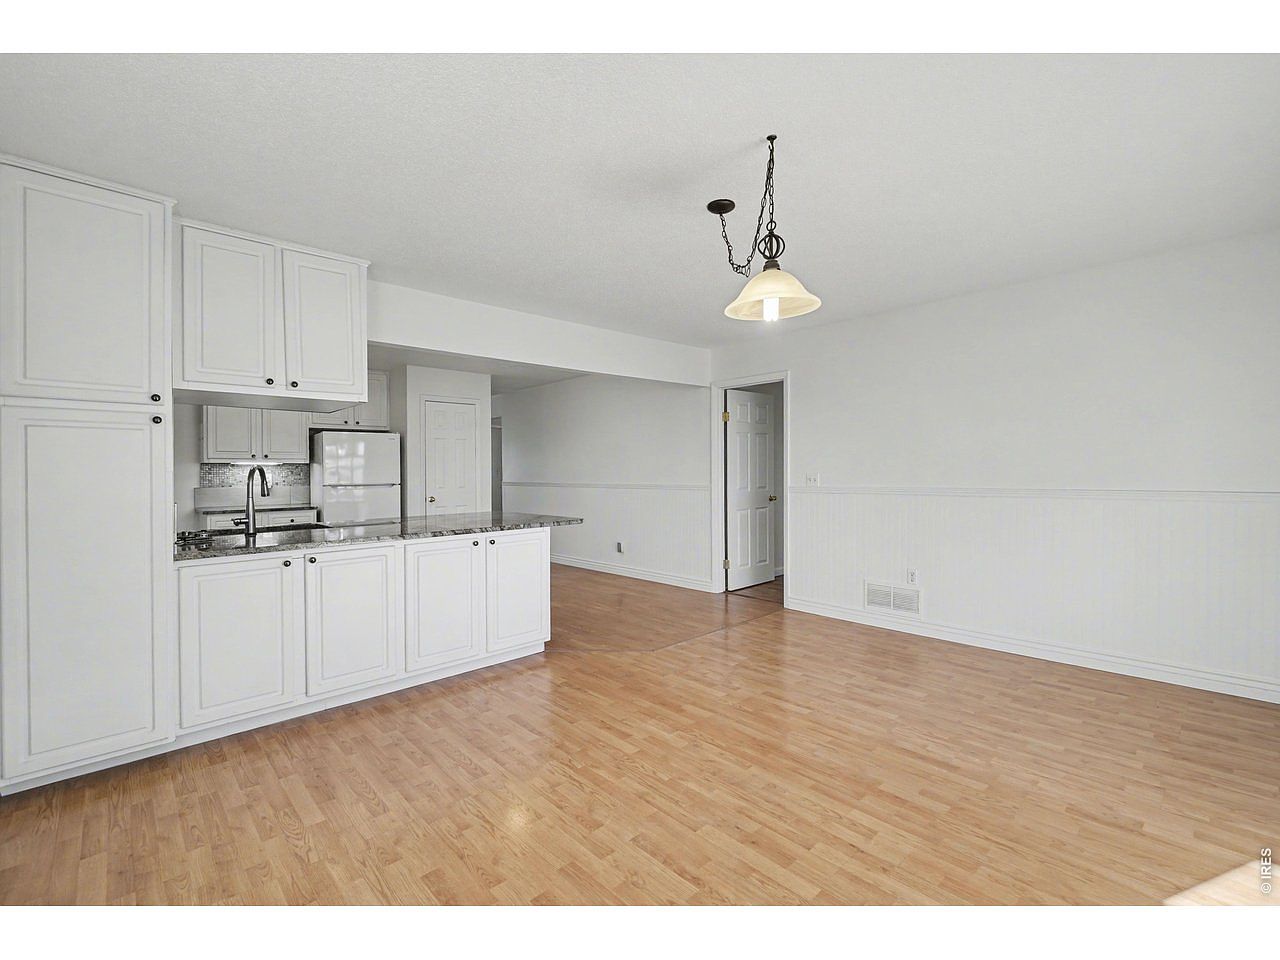
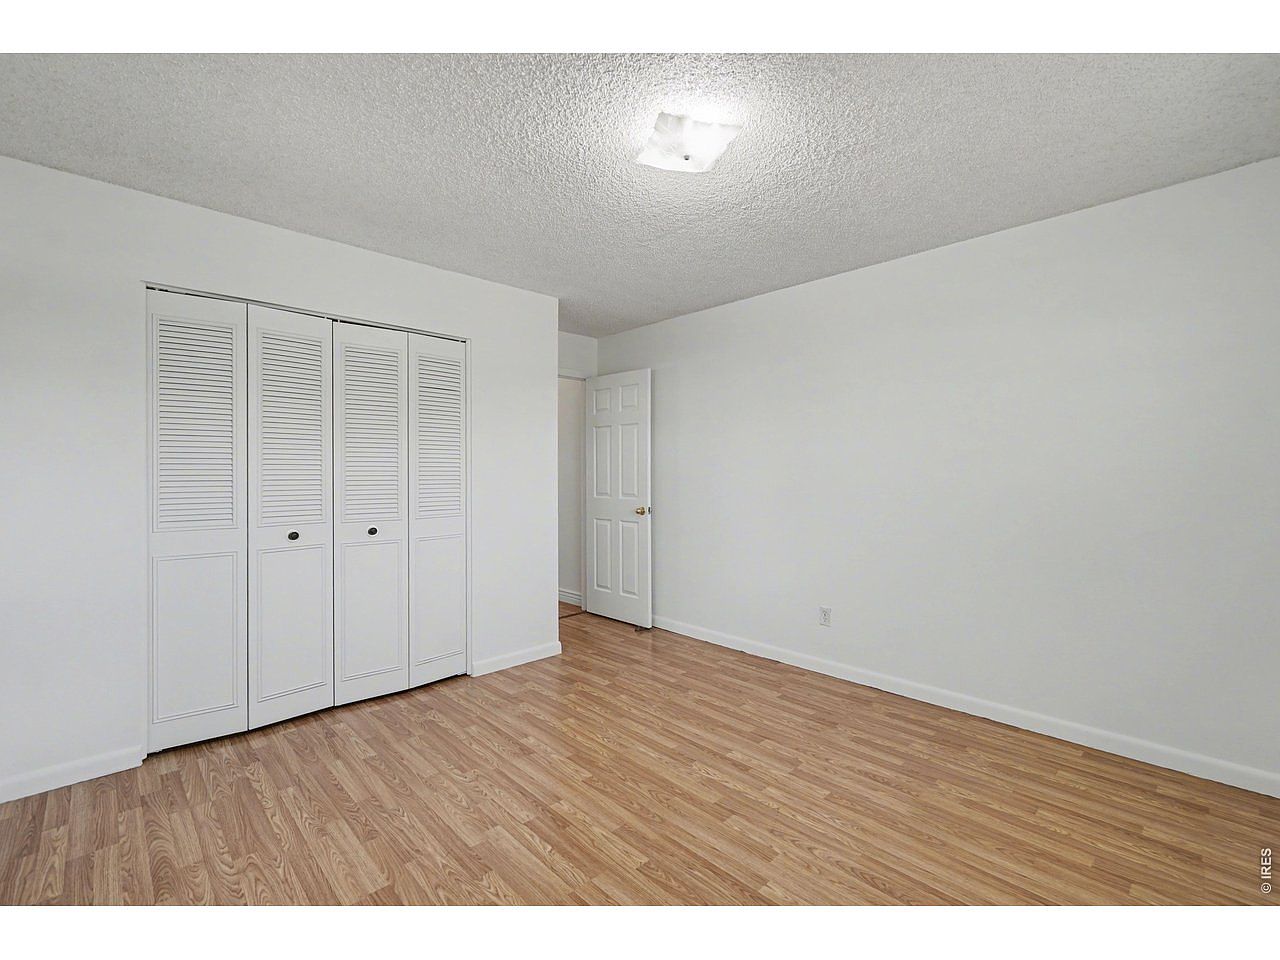
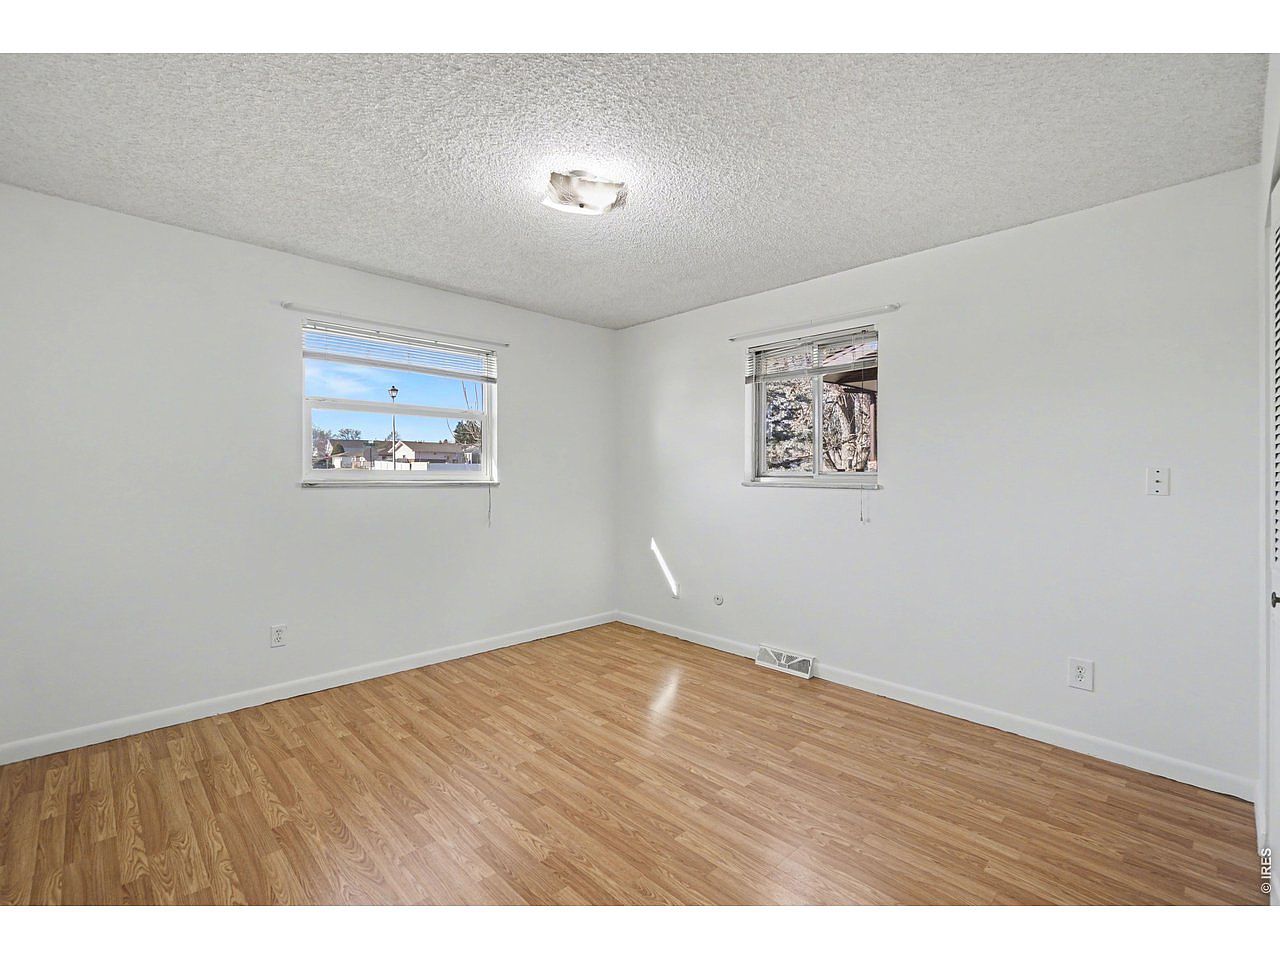
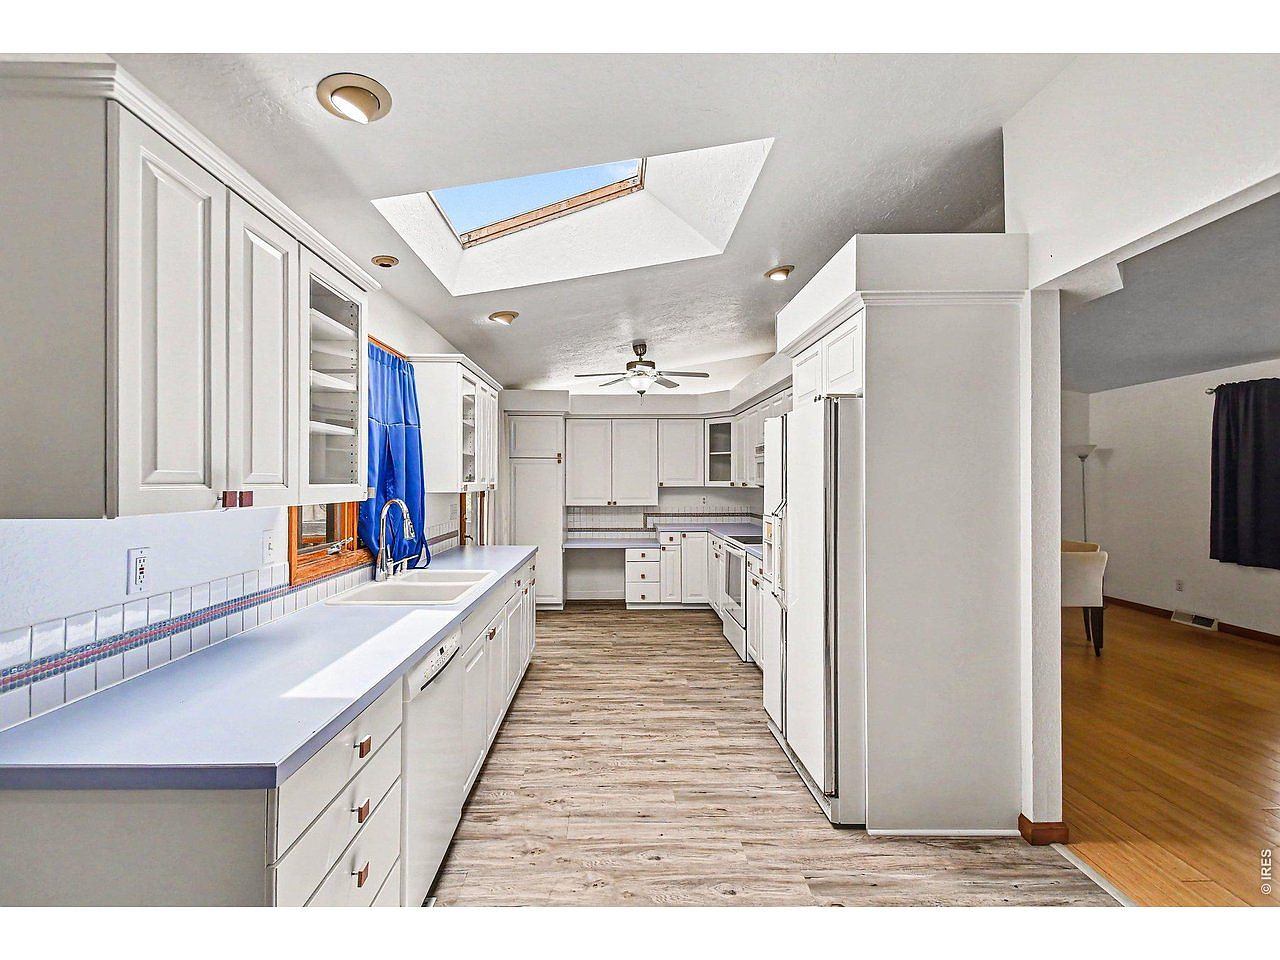
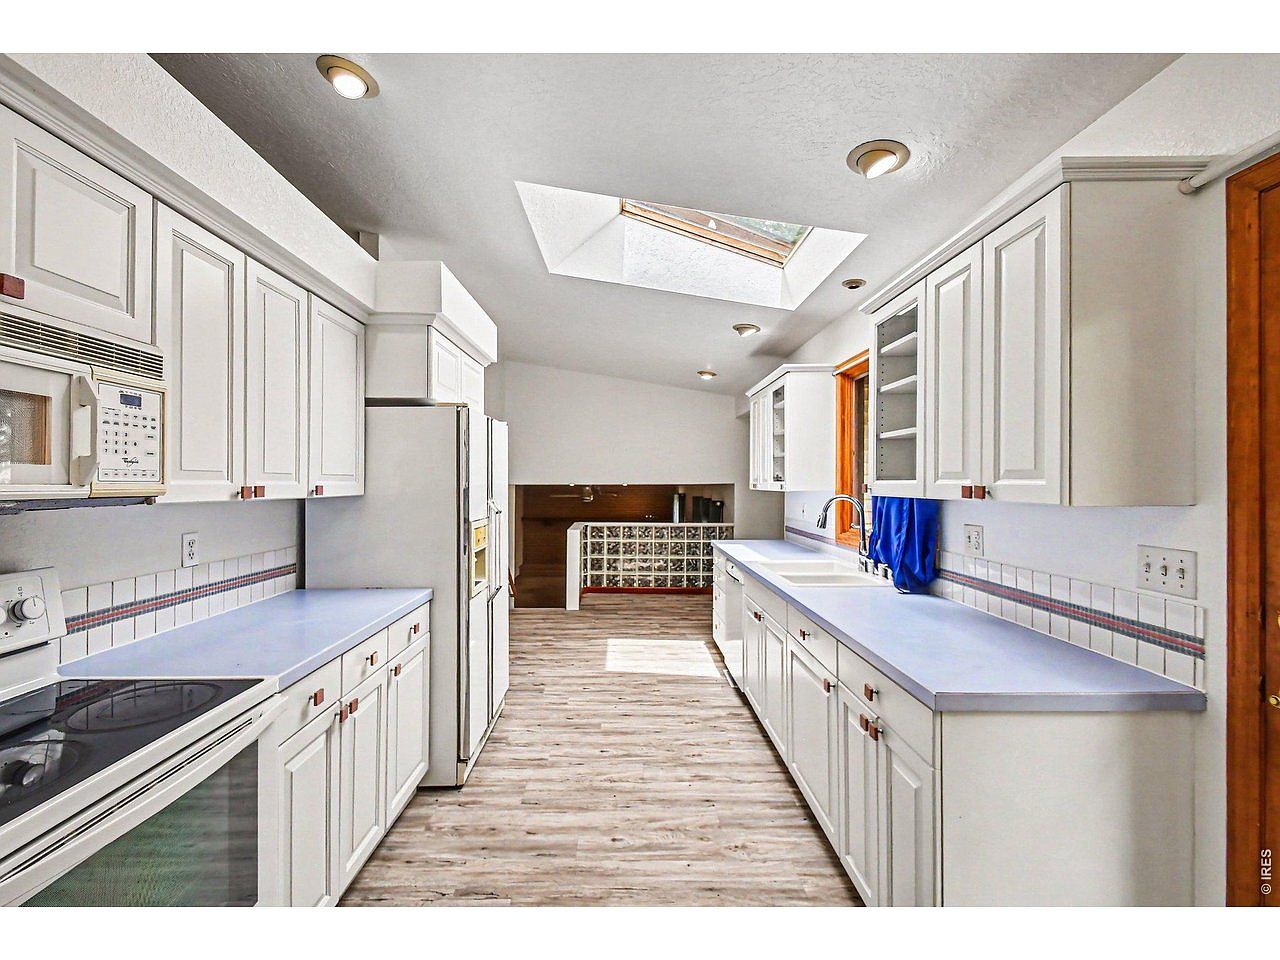
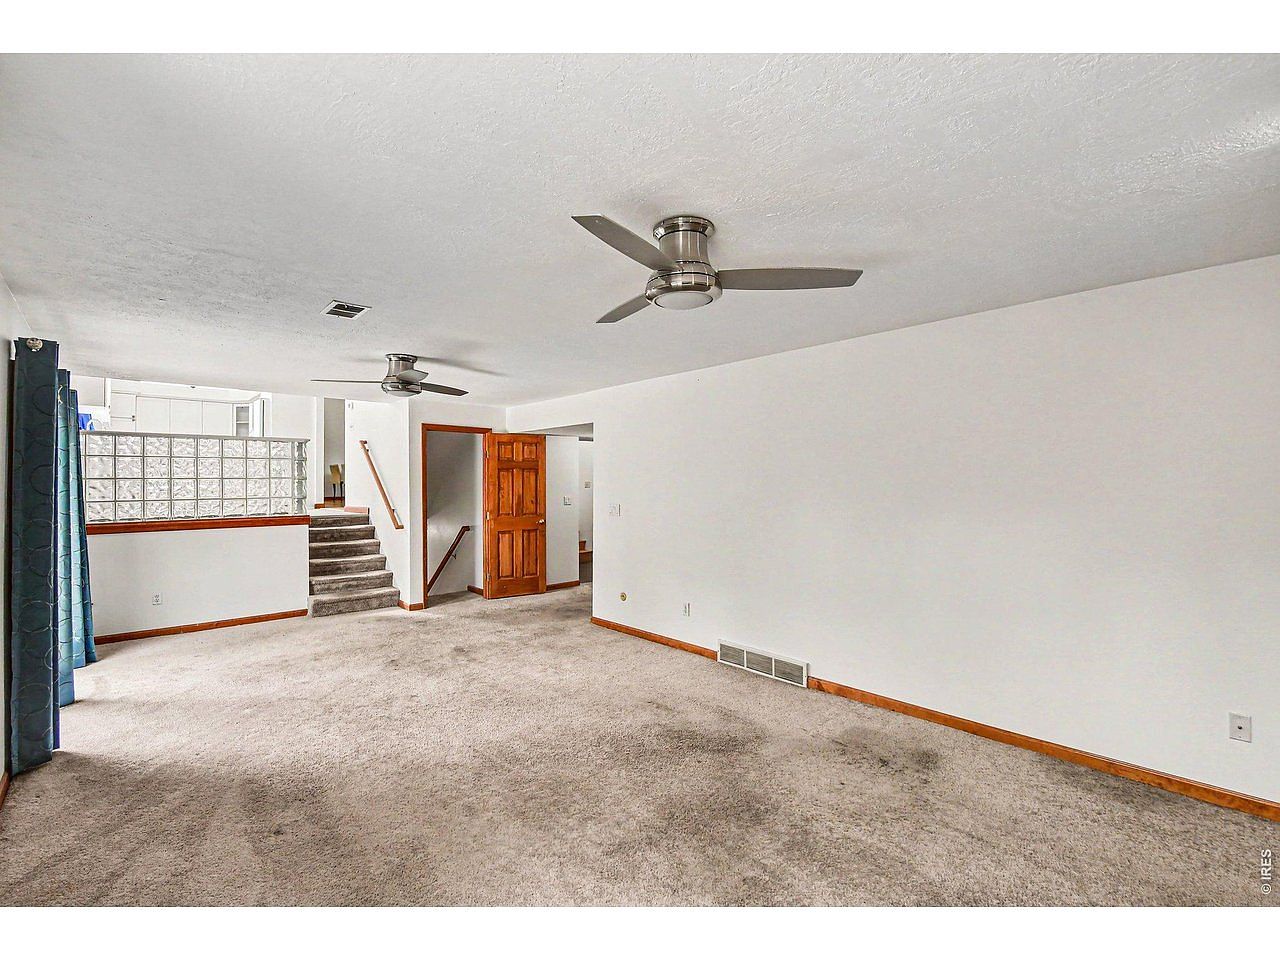
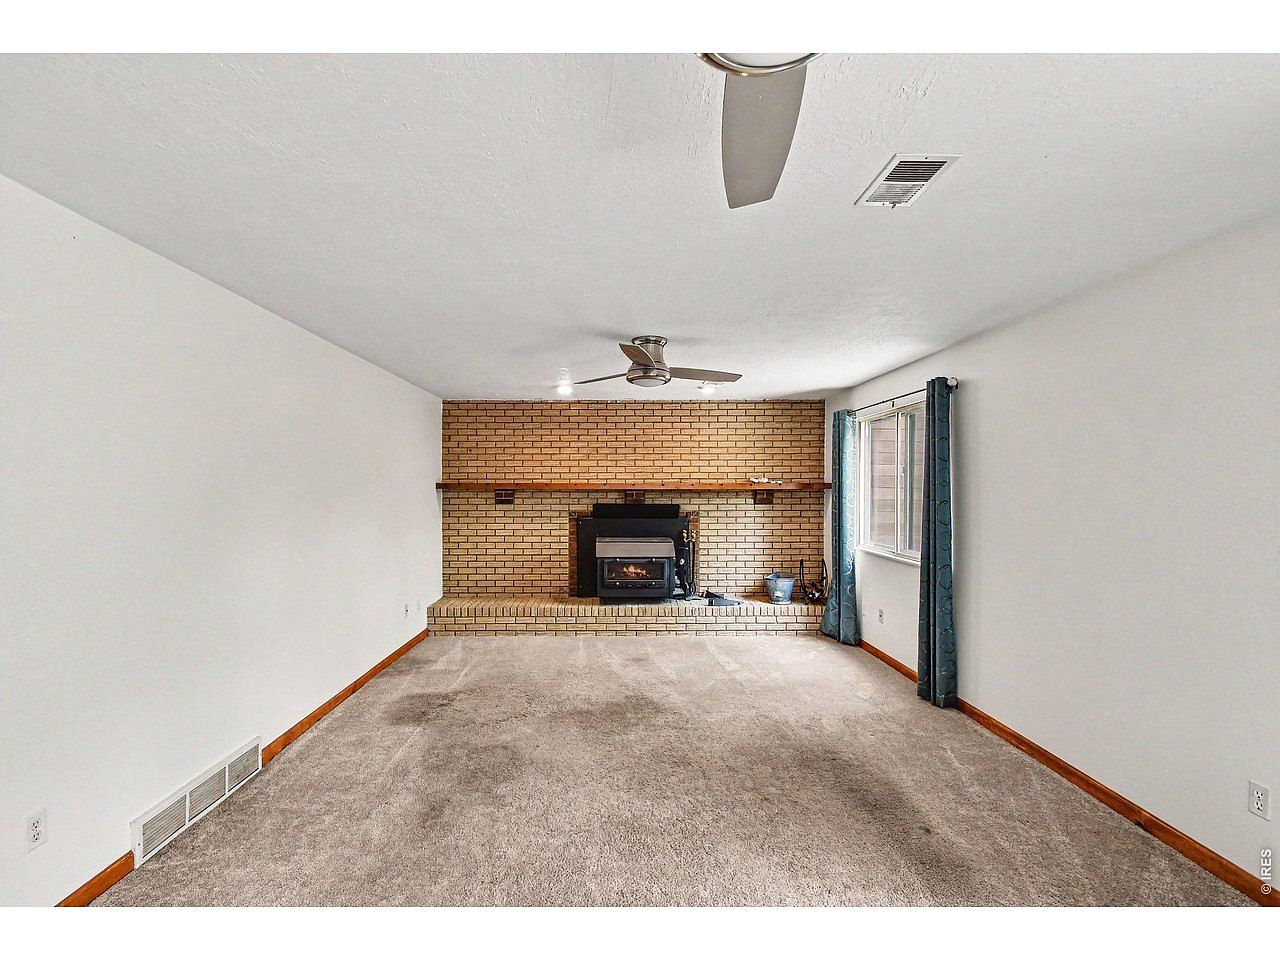
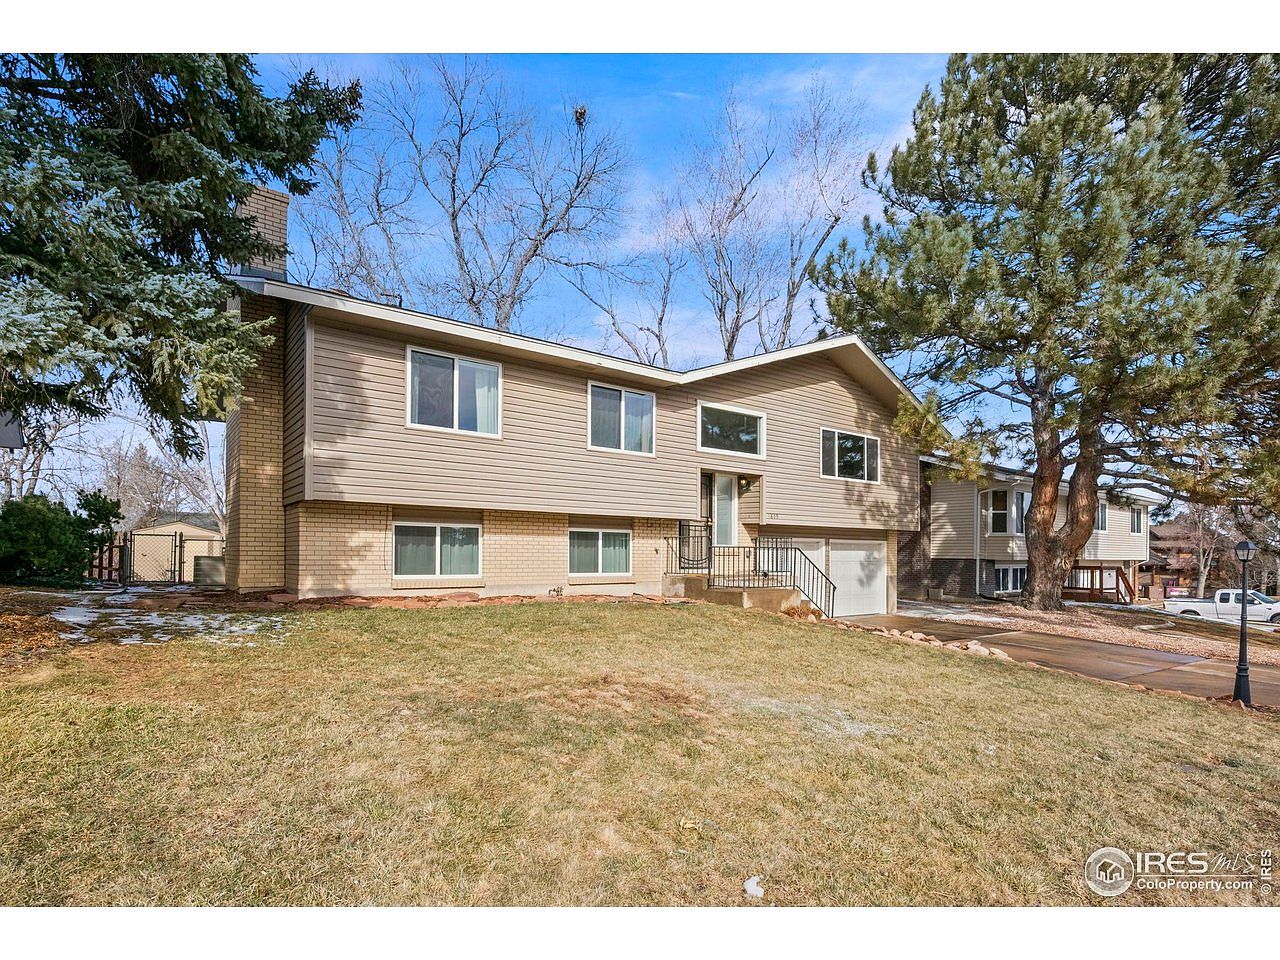
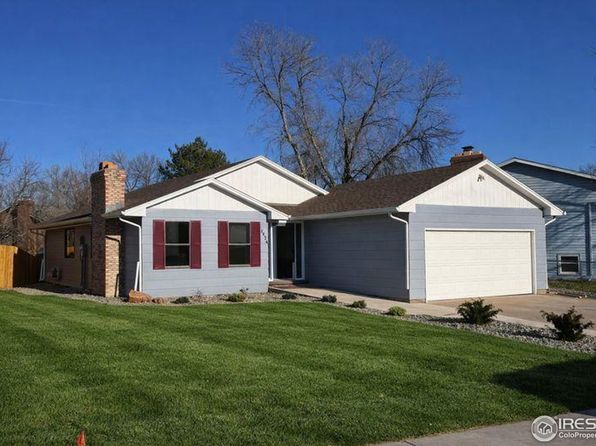
1843 24th Ave Ct
Your home
Size 2,392 sq ft
Beds · baths 4 · 2
Built · garage 1969 · 2-car
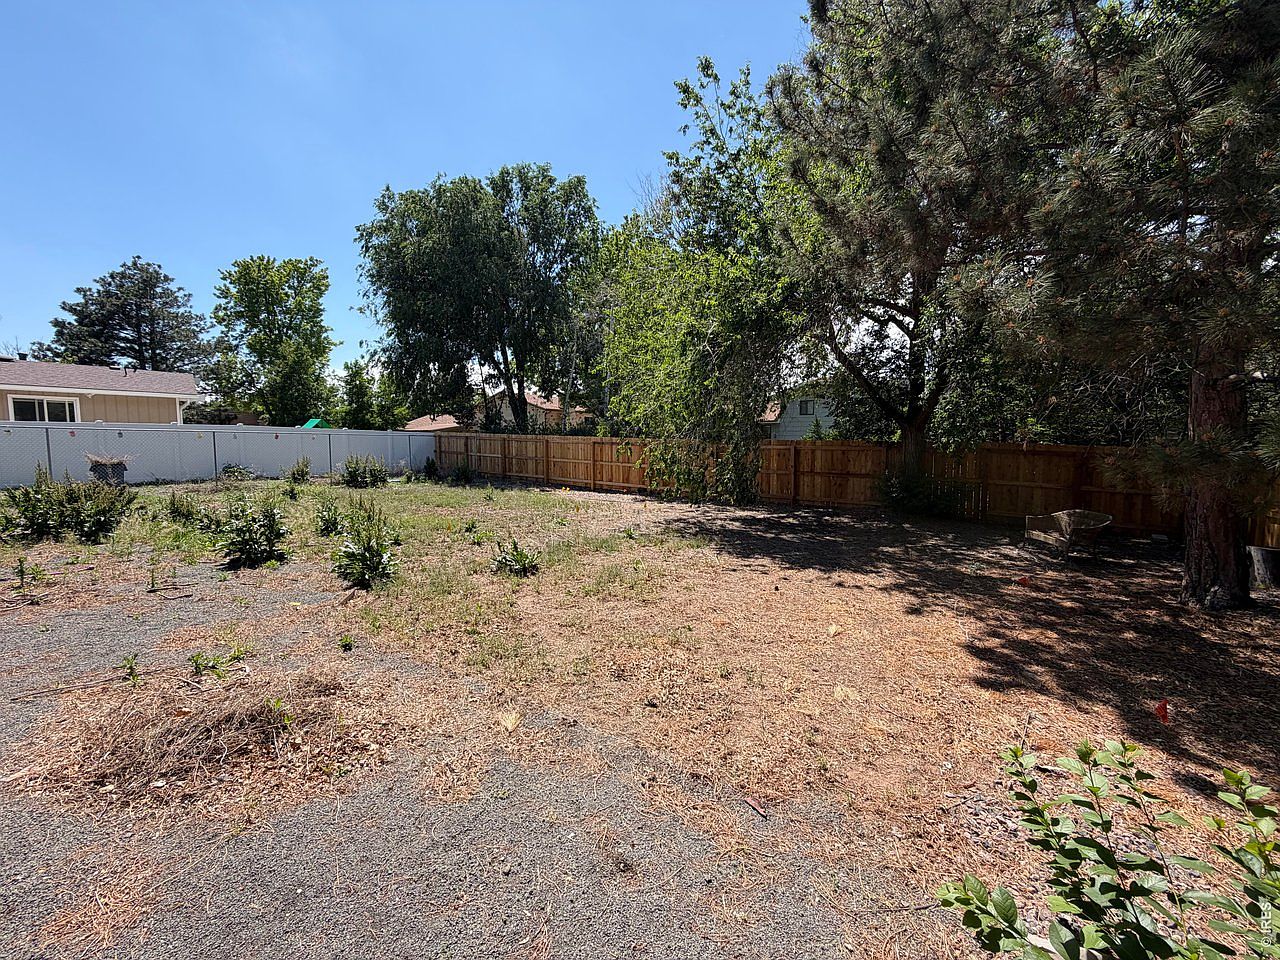
Lot 0.24 acre
1 / 14
Sold price
$400,000
Sold Jun 5, 2026 · listed at $400,000
$10,000 below our $410,000 price
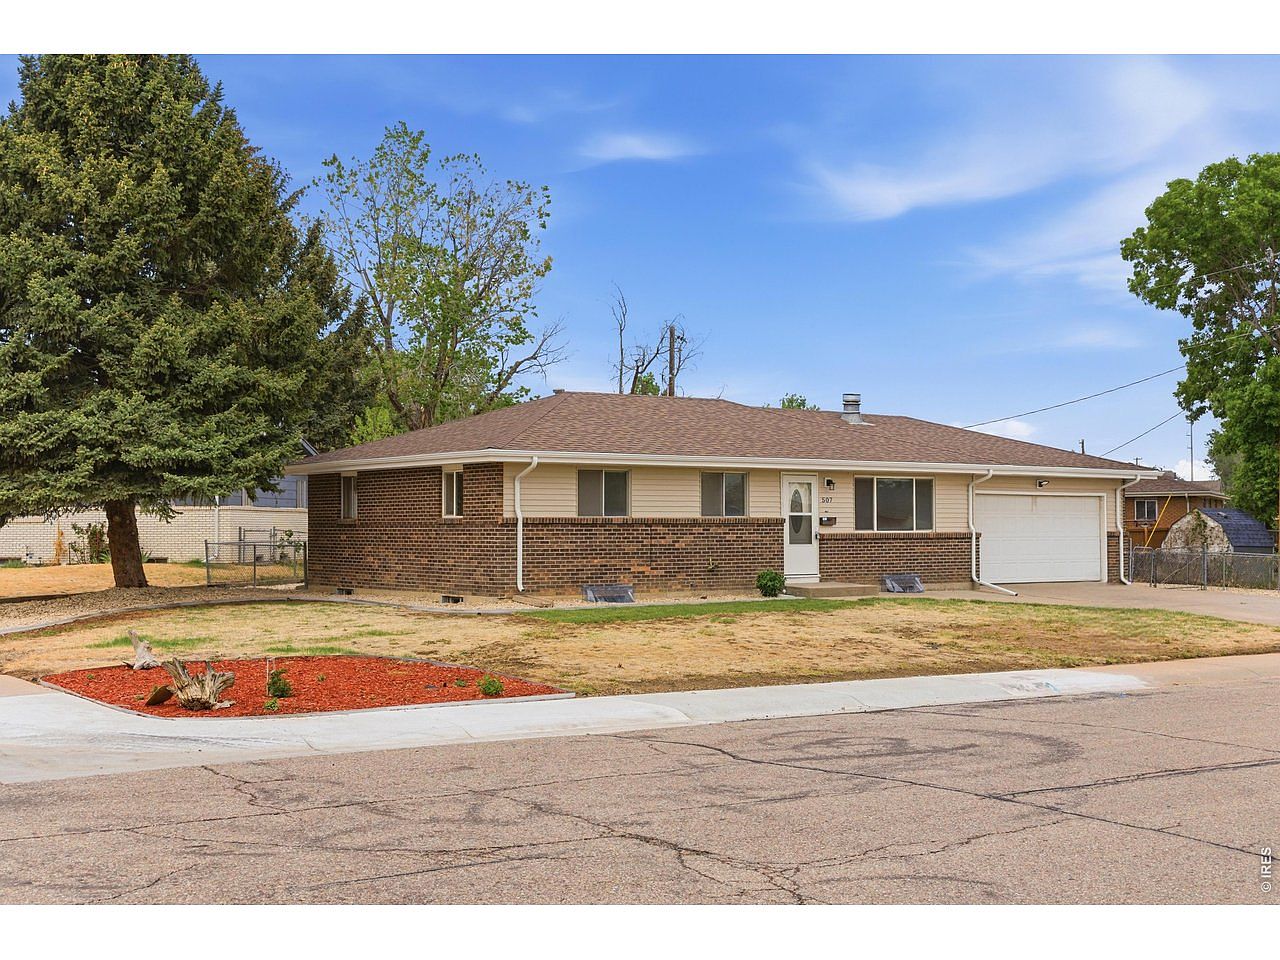
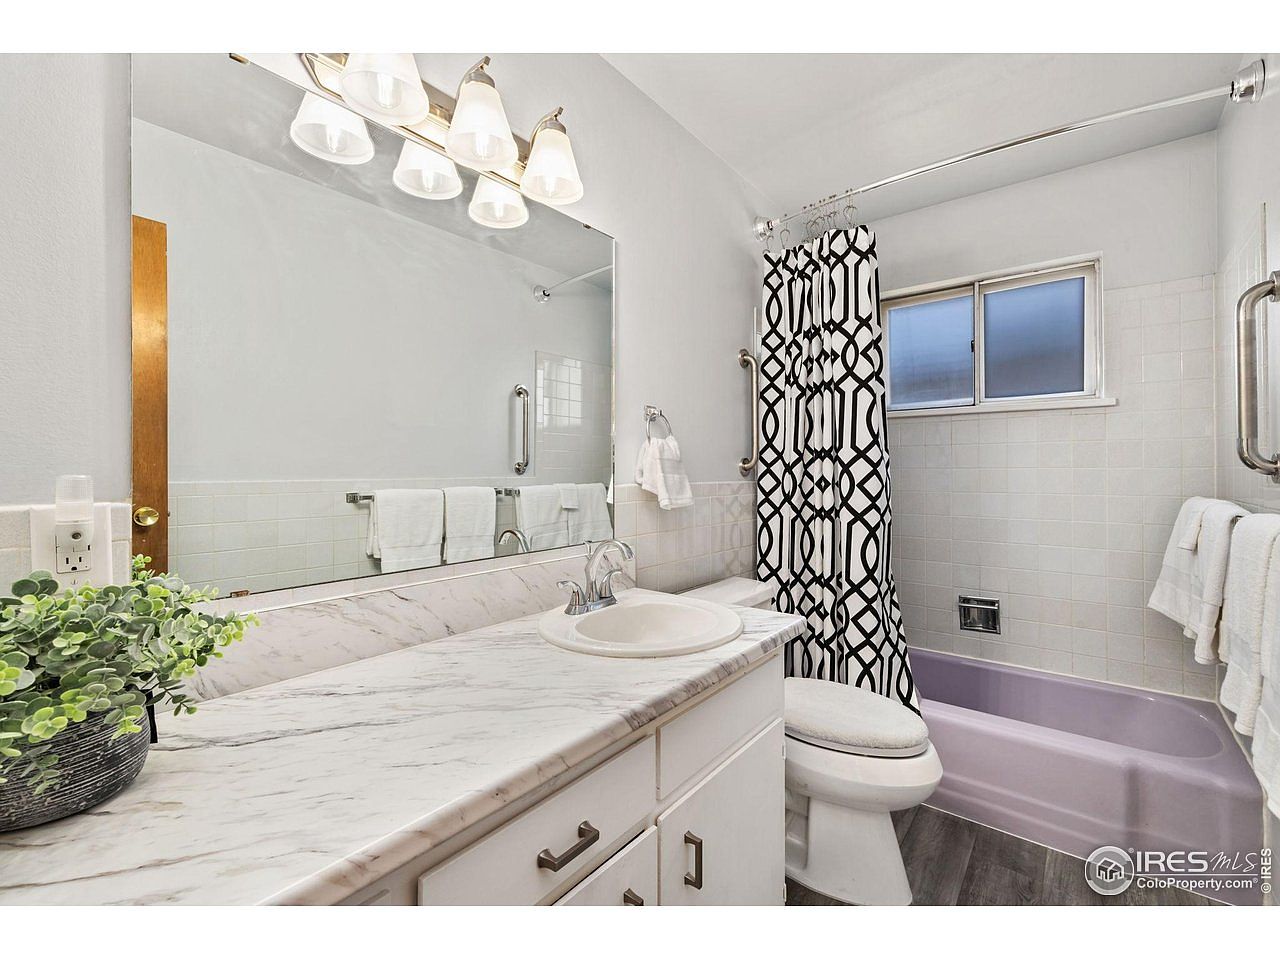
507 31st Ave
#1 · 99% match · MLS 1058635
72 sq ft smaller · same beds and baths · built within 5 years of yours · same garage size
Size 2,320 sq ft
Beds · baths 4 · 2
Built · garage 1969 · 2-car
On market · $/sq ft 29 days · $172
1 / 13
Sold price
$415,000
Sold Jul 6, 2026 · listed at $415,000
$5,000 above our $410,000 price
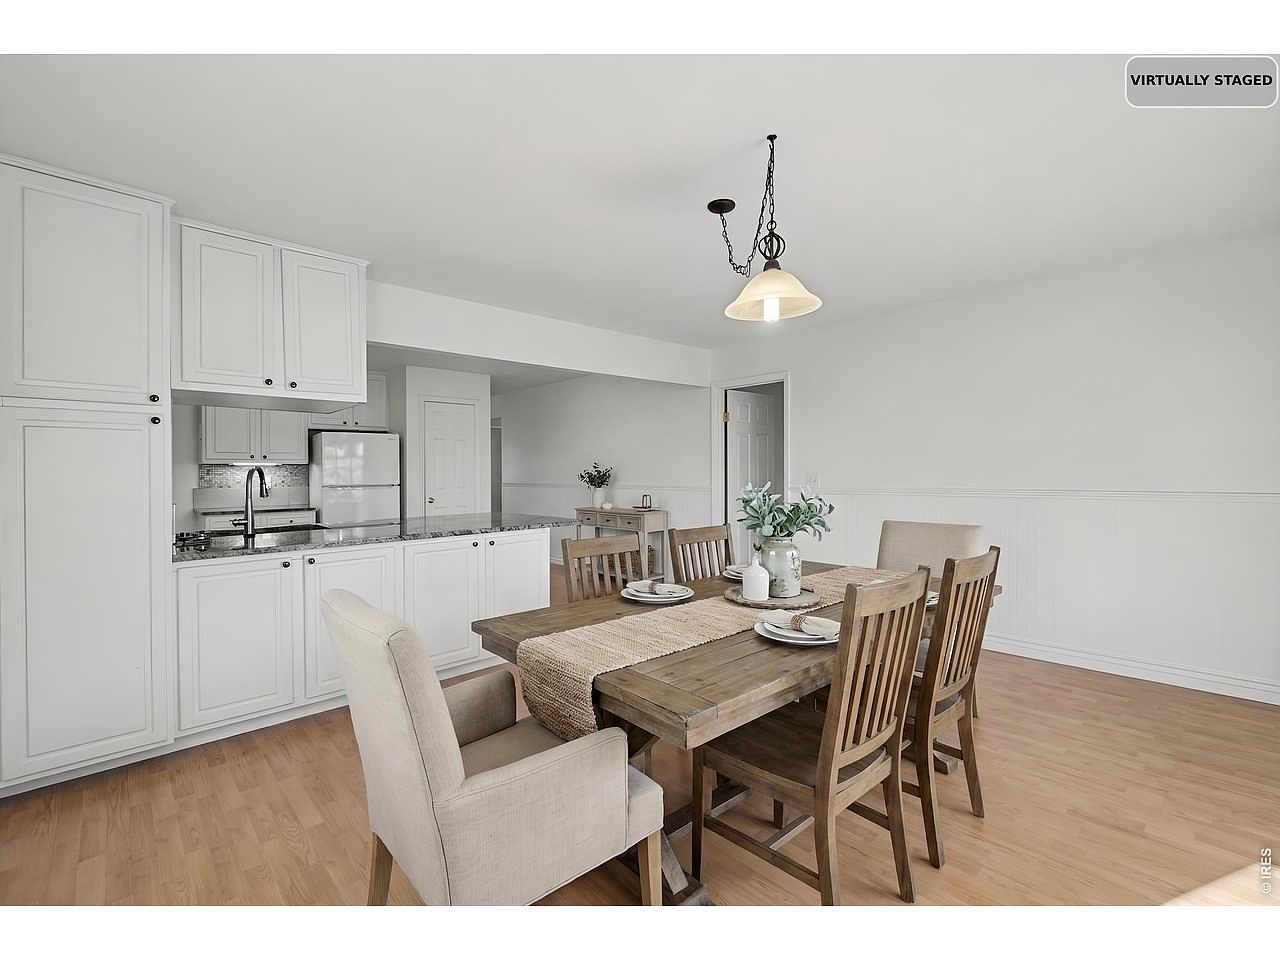
3711 W 7th St Rd
#2 · 96% match · MLS 1055502
174 sq ft smaller · same beds and baths · built within 5 years of yours · same garage size
Size 2,218 sq ft
Beds · baths 4 · 2
Built · garage 1972 · 2-car
On market · $/sq ft 95 days · $187
1 / 14
Sold price
$415,000
Sold Jul 2, 2026 · listed at $415,000
$5,000 above our $410,000 price
502 46th Ave
#3 · 82% match · MLS 1060462
about the same size · 4 bed · 3 bath · 9 years newer · same garage size
Size 2,420 sq ft
Beds · baths 4 · 3
Built · garage 1978 · 2-car
On market · $/sq ft 35 days · $171
1 / 12
Sold price
$425,000
Sold Apr 2, 2026 · listed at $412,500
$15,000 above our $410,000 price
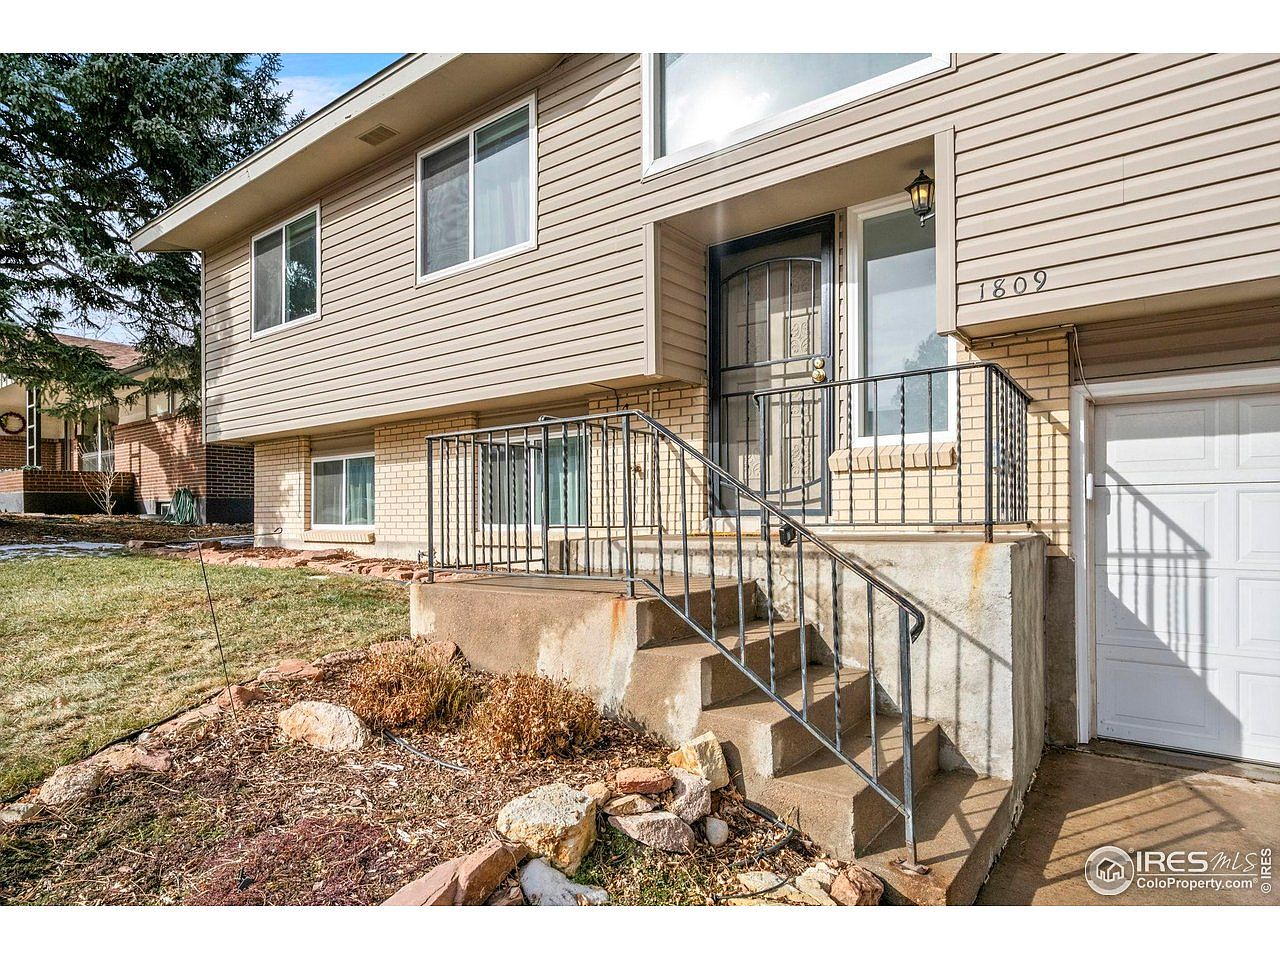
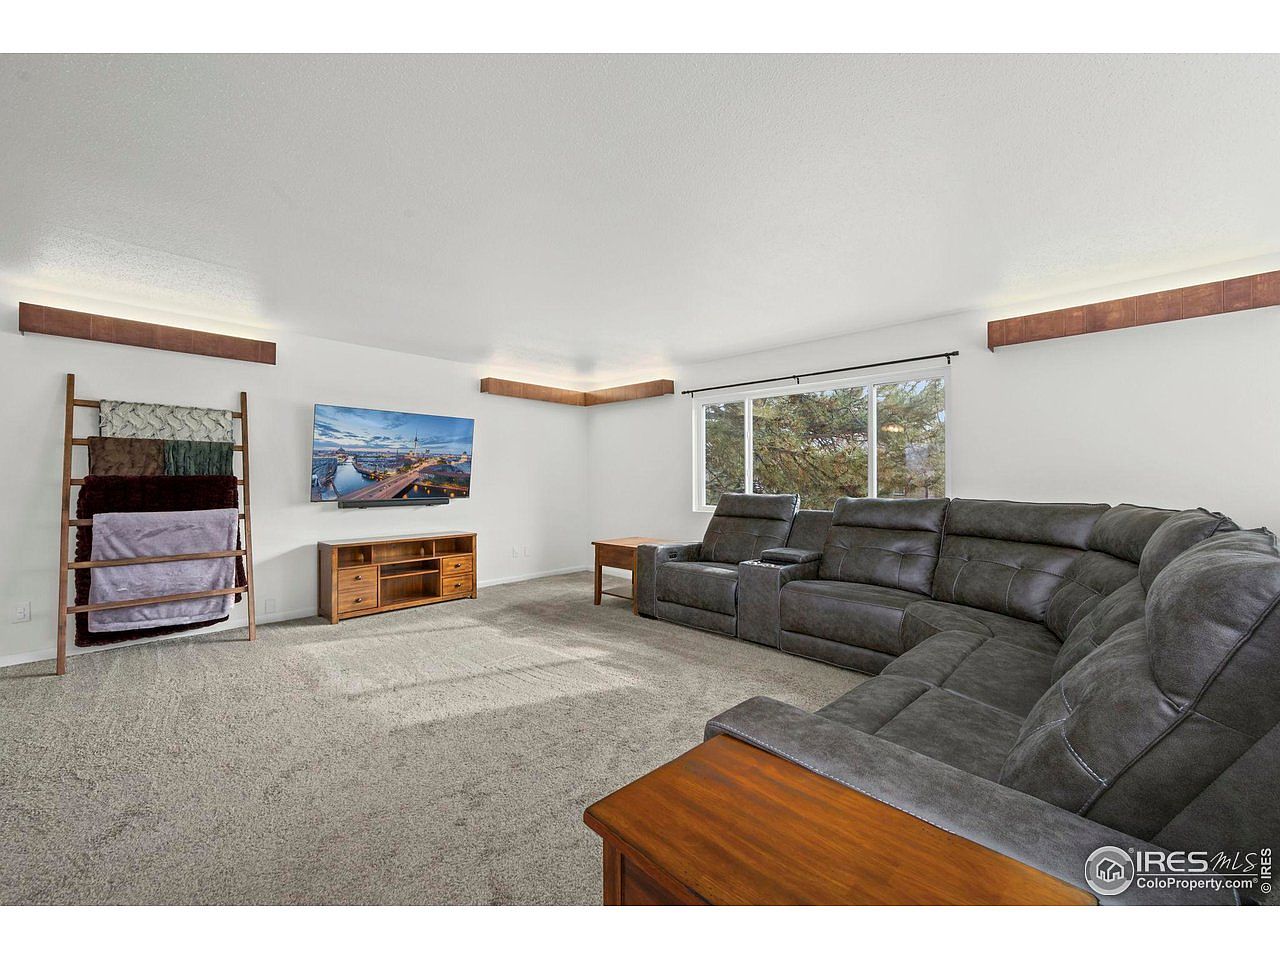
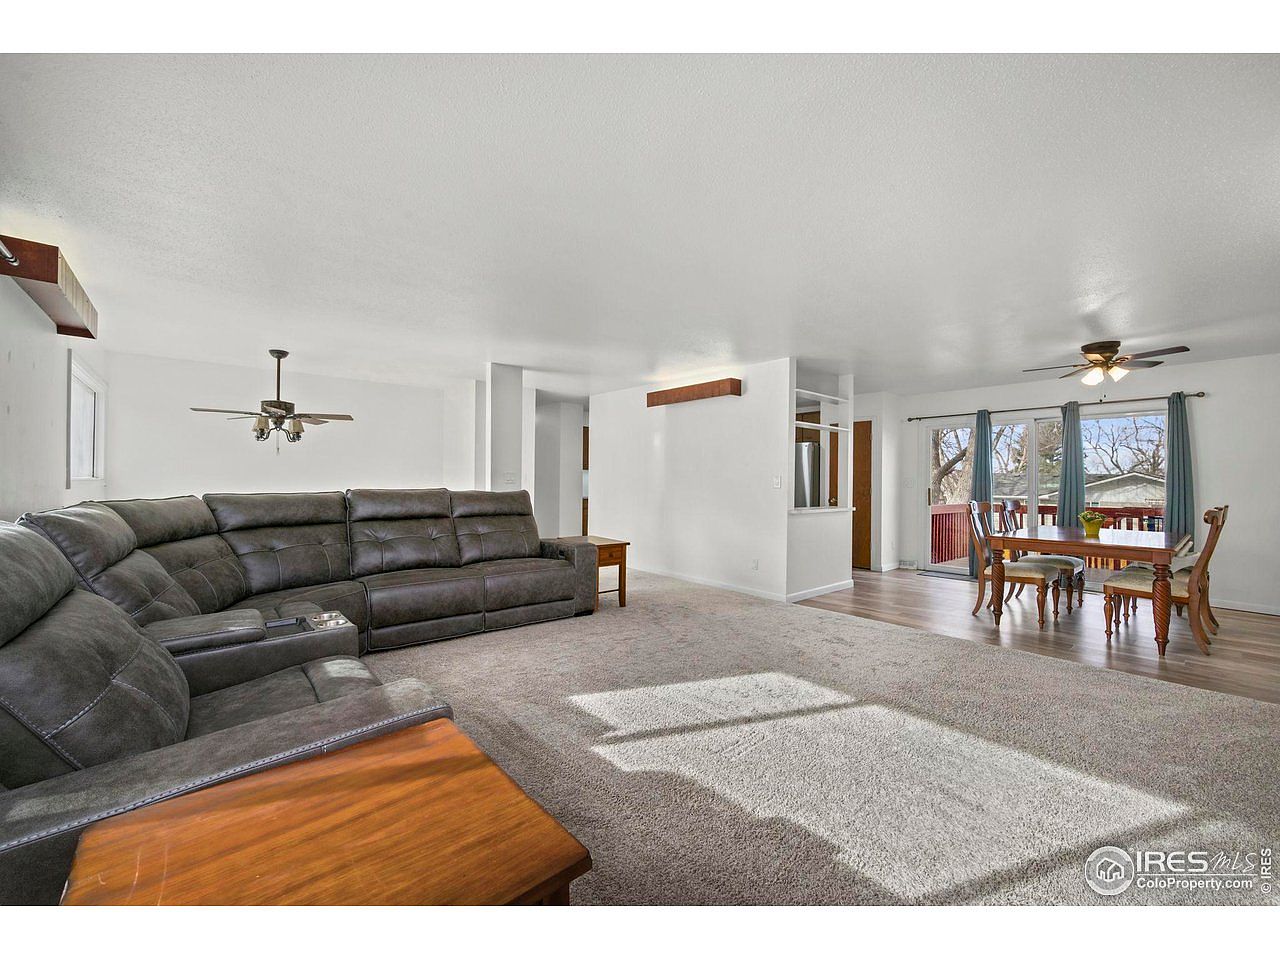
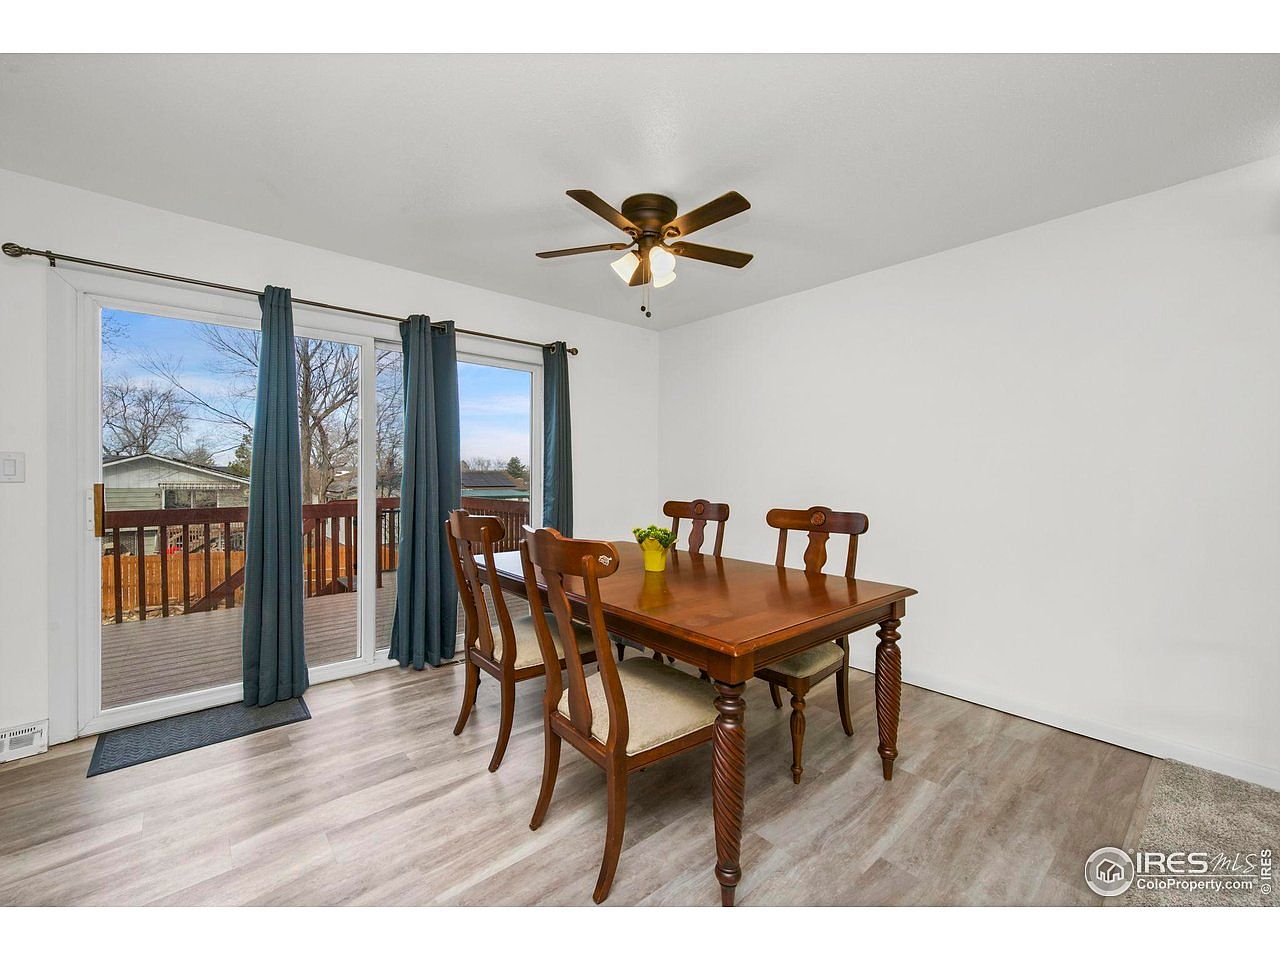
1809 24th Ave Pl
#4 · 80% match · MLS 1050778
82 sq ft smaller · same beds and baths · built within 5 years of yours · same garage size
Size 2,310 sq ft
Beds · baths 4 · 2
Built · garage 1967 · 2-car
On market · $/sq ft 59 days · $184
1 / 14
Sold price
$445,000
Sold Apr 20, 2026 · listed at $450,000
$35,000 above our $410,000 price
1424 40th Ave
#5 · 72% match · MLS 1051172
80 sq ft larger · same beds and baths · 10 years newer · same garage size
Size 2,472 sq ft
Beds · baths 4 · 2
Built · garage 1979 · 2-car
On market · $/sq ft 72 days · $180
1 / 13
Sold price
$420,000
Sold Jun 10, 2026 · listed at $425,000
$10,000 above our $410,000 price
821 36th Ave
#6 · 70% match · MLS 1049396
about the same size · 4 bed · 3 bath · built within 5 years of yours
Size 2,431 sq ft
Beds · baths 4 · 3
Built · garage 1964 · 1-car
On market · $/sq ft 150 days · $173
1 / 14
Sold price
$460,000
Sold Jun 5, 2026 · listed at $460,000
$50,000 above our $410,000 price
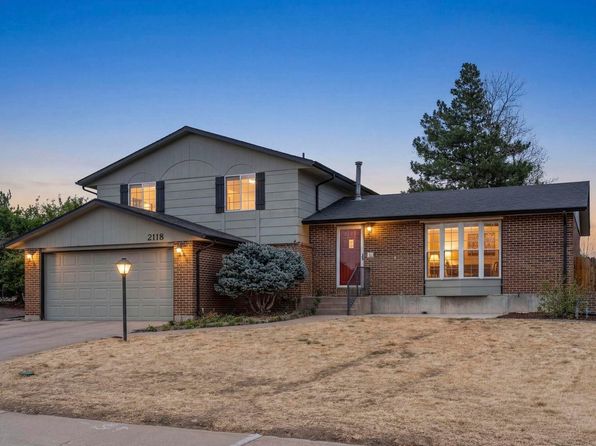
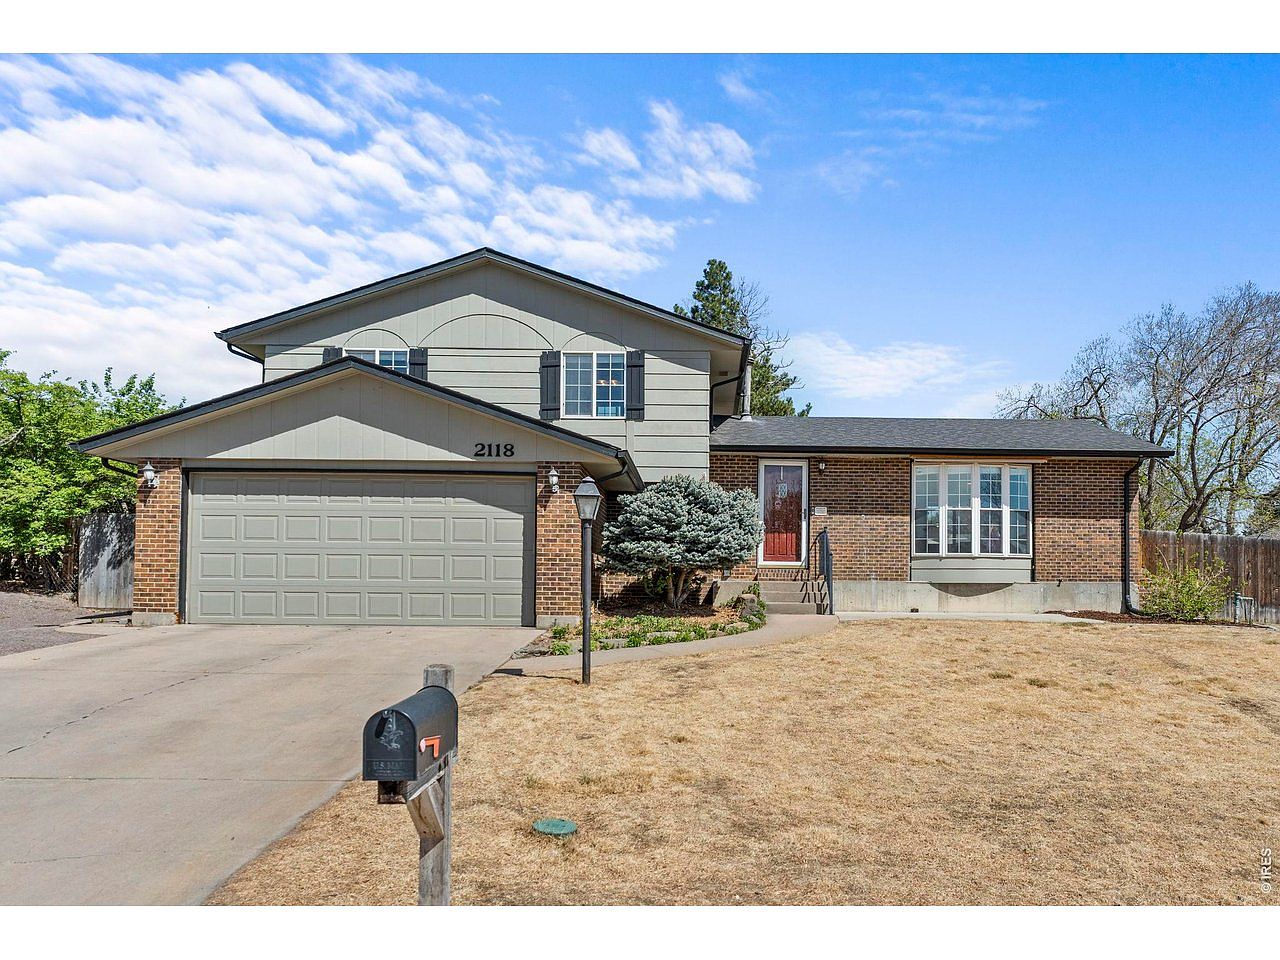
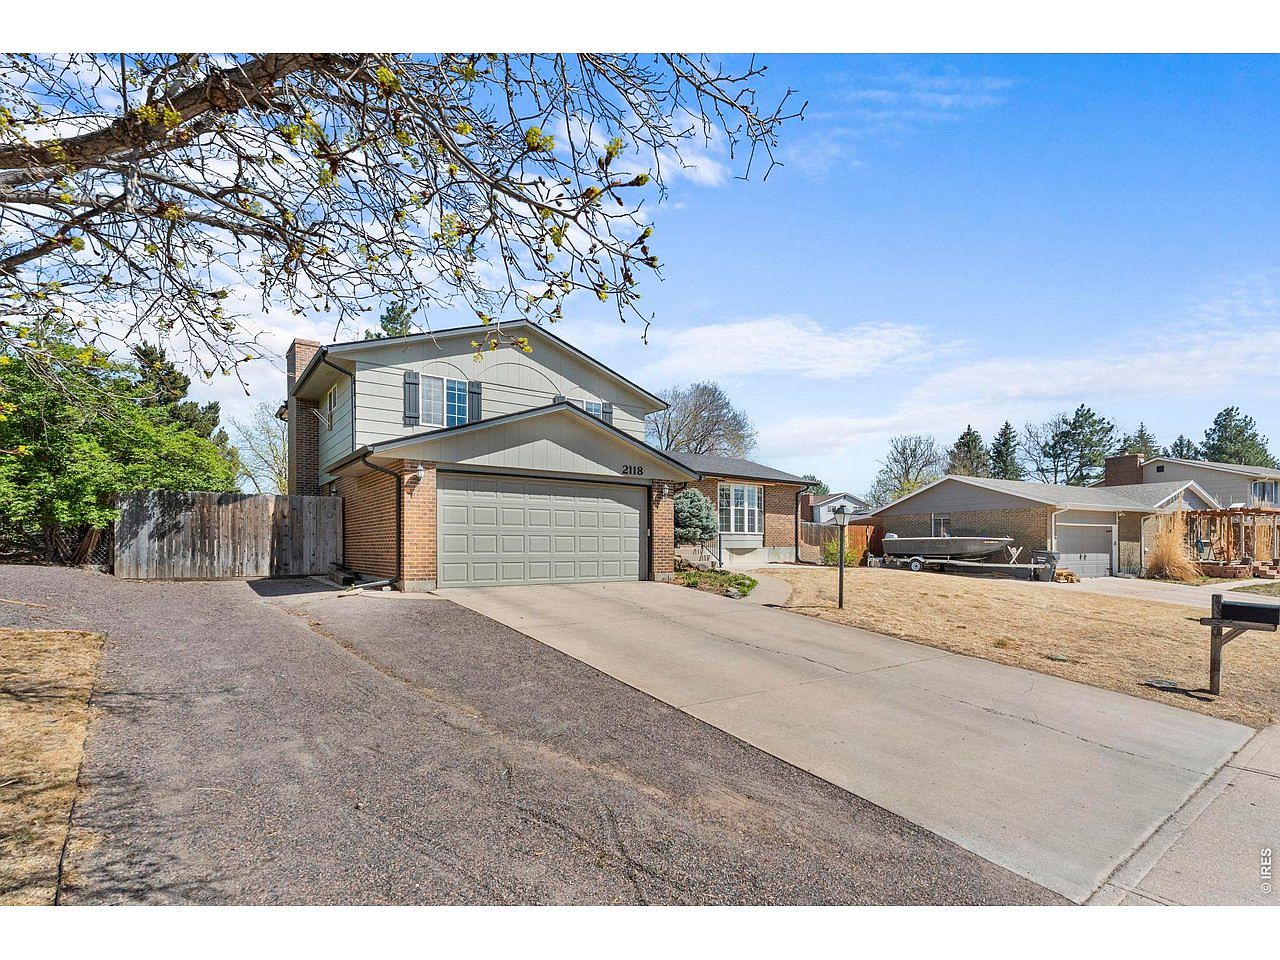
2118 27th Ave
#7 · 67% match · MLS 1056692
65 sq ft smaller · 5 bed · 3 bath · built within 5 years of yours · same garage size
Size 2,327 sq ft
Beds · baths 5 · 3
Built · garage 1972 · 2-car
On market · $/sq ft 51 days · $198
1 / 7
Sold price
$327,500
Sold Jun 17, 2026 · listed at $375,000
$82,500 below our $410,000 price
611 41st Ave
#8 · 66% match · MLS 1059984
288 sq ft smaller · same beds and baths · 8 years newer · same garage size
Size 2,104 sq ft
Beds · baths 4 · 2
Built · garage 1977 · 2-car
On market · $/sq ft 22 days · $156
Market map
Your home Selected comps
Hover a pin for a quick peek. Click a sold home to add or remove it as a comp.
Address
Sold on
Sold price
Sq ft
Beds/baths
Built
Garage
Days on market
$/sq ft
507 31st Ave
Jun 5, 2026
$400,000
2320
4/2
1969
2
29
$172
3711 W 7th St Rd
Jul 6, 2026
$415,000
2218
4/2
1972
2
95
$187
502 46th Ave
Jul 2, 2026
$415,000
2420
4/3
1978
2
35
$171
1809 24th Ave Pl
Apr 2, 2026
$425,000
2310
4/2
1967
2
59
$184
1424 40th Ave
Apr 20, 2026
$445,000
2472
4/2
1979
2
72
$180
821 36th Ave
Jun 10, 2026
$420,000
2431
4/3
1964
1
150
$173
2118 27th Ave
Jun 5, 2026
$460,000
2327
5/3
1972
2
51
$198
611 41st Ave
Jun 17, 2026
$327,500
2104
4/2
1977
2
22
$156
3Closest Comparable Sales · continued
Remaining close sales in this set — same ranking as the live presentation.
1 / 14
Sold price
$445,000
Sold Apr 20, 2026 · listed at $450,000
$35,000 above our $410,000 price
1424 40th Ave
#5 · 72% match · MLS 1051172
80 sq ft larger · same beds and baths · 10 years newer · same garage size
Size 2,472 sq ft
Beds · baths 4 · 2
Built · garage 1979 · 2-car
On market · $/sq ft 72 days · $180
1 / 13
Sold price
$420,000
Sold Jun 10, 2026 · listed at $425,000
$10,000 above our $410,000 price
821 36th Ave
#6 · 70% match · MLS 1049396
about the same size · 4 bed · 3 bath · built within 5 years of yours
Size 2,431 sq ft
Beds · baths 4 · 3
Built · garage 1964 · 1-car
On market · $/sq ft 150 days · $173
1 / 14
Sold price
$460,000
Sold Jun 5, 2026 · listed at $460,000
$50,000 above our $410,000 price
2118 27th Ave
#7 · 67% match · MLS 1056692
65 sq ft smaller · 5 bed · 3 bath · built within 5 years of yours · same garage size
Size 2,327 sq ft
Beds · baths 5 · 3
Built · garage 1972 · 2-car
On market · $/sq ft 51 days · $198
1 / 7
Sold price
$327,500
Sold Jun 17, 2026 · listed at $375,000
$82,500 below our $410,000 price
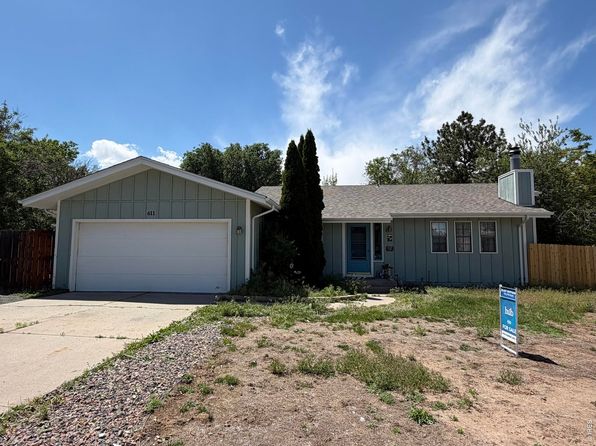
611 41st Ave
#8 · 66% match · MLS 1059984
288 sq ft smaller · same beds and baths · 8 years newer · same garage size
Size 2,104 sq ft
Beds · baths 4 · 2
Built · garage 1977 · 2-car
On market · $/sq ft 22 days · $156
4How Does Your Home Compare?
Condition is the one thing you can still change before listing. We start at 5 out of 10 (typical for these sales) and adjust together.
Compare your home with the sales above. Condition, updates, and curb appeal change what buyers will pay. Pick the band that fits, or fine-tune from 0 to 10, and the price in step 7 updates.
05 typical10
Price adjustment for condition
—
Your rating
5 of 10
Starting at 5 of 10, typical for these sales. The recommended price in step 7 uses this rating.
5Your Price Next to Similar Sales
At $410,000, you would be priced higher than 43% of similar homes that sold (Aug 2024 – Jul 2026), and at or below the other 57%.
Each dark dot is a sale and each light blue dot is a home for sale, placed by price and size. The red diamond is your home at the recommended price. The orange line is the typical sold price for each size.Recent sales
6Pace: Is the Market Speeding Up or Slowing?
Sales are running about even with last year. (Jan 1 – Jul 13, both years.)
2025
Full year
144 sales · $400k median price · 48 days median on market
2026
Jan 1 – Jul 13 (part of the year)
76 sales · $397k median price · 43 days median on market
Sales volume
The detail
From Jan 1 to Jul 13, 76 similar homes sold in 2026, compared with 75 over the same dates in 2025 (+1%). All of 2025 had 144 sales. The 2026 bar below is a partial year (through Jul 13), so compare it to the same months, not to the full 2025 bar.
Homes sold, by year
Homes sold each month, this year vs last
Prices: What Buyers Are Paying
Prices are about the same as last year: median sold price $397k in 2026 so far vs $400k in 2025 (-0.8%).
The median is the middle sale: half of these homes sold for more, half for less.
Price movement
The detail
Median sold price was $400,000 in 2025 and $396,950 in 2026 so far (-0.8%). Monthly medians move around because each month has only about 11 sales, so read the overall level, not any single month.
Median sold price by year
Median sold price by month
Timing: Days on Market
Half of the homes that sold here were on the market 46 days or less (Aug 2024 – Jul 2026).
Time on market
The detail
Median days on market: 43 days in 2026 so far vs 48 days in 2025. Homes are selling a little faster than last year.
Median days on market, by year
Homes sold, by days on market (orange = the median)
Homes sold per month
What works for your home
Larger than typical living area for this market segment.
Two-car (or larger) garage is expected by most buyers in this price range.
What to watch
Main risk is overpricing relative to the current absorption rate.
7Price It: Choices and Trade-Offs
Our recommendation is below. Try other prices with the slider or the five options: each shows the expected days to go under contract and the chance of a contract within 30 days, based on how similar homes sold.
Recommended List Price
$410,000
Zillow estimate (Zestimate)
Supported range $396,000 – $426,000 · expected under contract in about 46 days
Top 57% of similar recent sales
AggressiveHeart of marketOverpriced
Bottom line:This is a strong seller's market with 2.2 months of inventory. Based on 257 recent sales, your home is best positioned between $396,000 and $426,000, with a recommended list price of $410,000. At that level we would expect roughly 46 days to contract. Launch inside the competitive range — that creates the strongest outcome.
Rec
—Recommended—
Pick a price above to see how it compares.
While You Are on the MarketSimilar homes priced below yours
Buyers compare price first. The higher your price, the more similar homes they will see priced below yours, today and while you wait for an offer.
4
For sale now, priced below yours
~3.5
New listings a month priced below yours
~9
Lower-priced choices buyers will see before you sell
At $410,000about 46 days to go under contract
At the recommended price, few similar homes are priced below yours. Pricing higher adds lower-priced competition.
After You List: Your Weekly Market Fingerprint
Once you are on the market, we track similar homes every week: new listings, contracts, and sales.
Estimated proceeds at the price selected in step 7. Change any line to match your situation. These are estimates, not a closing statement.
Selling costs
Seller broker fee
%
—
Buyer broker fee
%
—
Seller concession credits offered to the buyer
$
—
Inspection repairs typical allowance
$
—
Total selling costs
—
Closing expenses· seller-paid
Property taxes annual rate, prorated to the closing date
%
—
Closing date drives the tax proration
—
Owner's title policy estimated at about 0.15% of price
$
—
Owner's extended coverage
$
—
Bundled closing fees
$
—
Final water final utility reading
$
—
Total closing expenses
—
Mortgage payoff
Seller loan balance current mortgage payoff, not a selling cost
$
—
Total deductions selling + closing + payoff
—
Estimated net to seller
—
at — · — of list
—
—
Estimates only. Your closing company issues the official figures. Loan balance, concessions, and fees change this the most.
Full Market Data
Every listing in this MLS export. Active homes are the competition; Pending and Backup are under contract. Dark In comps buttons mark the sales used above (click to remove).
Tip: paste one or more MLS numbers separated by commas or spaces.
Report sections
All sections are included by default. Uncheck any you want to hide on this presentation (and in print).
Add listing photo
From Matrix: open the listing → right-click the main photo → Copy image address. Or upload a photo you saved from MLS.
 Pricing Story